

BTC Price Prediction May 2026: Can BTC Hold $81K and Push Toward $100K?

- Bitcoin crossed $81,000 — its highest price since January — driven by three converging forces: geopolitical relief, record ETF inflows, and a major short squeeze.
- U.S. spot Bitcoin ETFs pulled in $2.44 billion in April, the strongest monthly figure since October 2025, signaling a clear return of institutional demand.
- Over $300 million in short positions were liquidated in 24 hours as BTC reclaimed $80,000, adding mechanical buying pressure on top of organic demand.
- The $83,000 level — where Bitcoin's 200-day moving average sits — is the next critical test that will define whether this is a genuine recovery or a temporary bounce.
- When Bitcoin rallies with institutional backing, capital has historically rotated into major altcoins including ETH, SOL, XRP, and TON — though timing varies.
- Key risks remain: Bitcoin is still roughly 35% below its all-time high, and Strategy's potential BTC sell to fund dividends could introduce fresh supply pressure.
What Pushed Bitcoin Past $81,000?
1. The US-Iran Conflict and "Project Freedom"
2. Institutional and ETF Inflows Hit Multi-Month Highs
3. The Short Squeeze Effect
Bitcoin (BTC) Price Prediction May 2026 — Key BTC Price Levels to Watch
1. Key Support Levels Holding the Bullish Structure
2. The $83,000 Resistance — The Real Test
3. BTC Price Prediction — Analyst Targets for May and Beyond
How the BTC Rally Affects the Broader Crypto Market
Ethereum (ETH) — Layer-2 Growth and Institutional Demand
Solana (SOL) — High-Speed Chain With Momentum
XRP — Regulatory Clarity as the Catalyst
TON — Telegram's Ecosystem Play
Trading the Altcoin Rotation on MEXC
Risks That Could Slow Bitcoin's Momentum
- Distance from ATH: Despite a 12% monthly gain in April, Bitcoin remains roughly 35% below its all-time high reached in October 2025.
- Middle East re-escalation: If US-Iran tensions spike again, risk-off sentiment could reverse quickly and drag BTC lower with traditional markets.
- US macro data: Jobs data due this Friday and any hawkish signal from the Fed could add selling pressure to risk assets across the board.
- Strategy's BTC holdings: Strategy — the largest corporate holder of Bitcoin — signaled it may sell part of its 818,334 BTC stash for the first time, to help fund dividend payments. Any large-scale sale would be a notable supply overhang.
- ETF outflow risk: If sentiment shifts and ETF inflows reverse, the institutional pillar supporting this rally weakens.
FAQ
Conclusion
Popular Articles
View More
MEXC Alpha Trader Research Weekly | NFP Sparks a Rebound, but ETF Outflow Pressure Lingers: Can BTC Hold $63,000?
Week 1, July 2026 Reporting Period: July 1–7, 2026 Data Cutoff: July 7, 2026 Core Narrative Over the past week, the crypto market experienced a dramatic reversal, falling first before staging a

Bitcoin (BTC) Price Prediction July 2026: Can BTC Still Hit $100K After Crashing Below $60,000?
Bitcoin just closed out one of its toughest stretches of 2026, falling roughly 30 percent through the first half of the year and landing on track for its second straight quarterly loss, only the

MEXC Alpha Trader Research Weekly | BTC Falls Below $60K as June ETF Outflows Hit Record Highs: How Far Is the Bottom?
Week 4 of June 2026 Reporting period: June 24 – June 30, 2026 Data Cutoff: June 30, 2026 Core Narrative Over the past week, the crypto market saw its sharpest sell-off since September 2024. On June
Hot Crypto Updates
View More
Why Is Crypto Down Today? Bitcoin Slides Toward $62,000 as US-Iran Ceasefire Collapses
Key Takeaways Bitcoin (BTC) fell more than 2% to around $62,000 on July 8, 2026 after US President Donald Trump declared the ceasefire with Iran over at the NATO summit in Ankara. More than $450

Will Nonfarm Payroll Move Bitcoin Tonight?
Overview The U.S. June nonfarm payrolls report will be released at 8:30 a.m. ET on July 2, 2026. According to the U.S. Bureau of Labor Statistics release schedule, this report is coming on Thursday

BTC Just Broke $60K Again - And Prediction Markets Are Bracing for Worse
Overview Bitcoin fell below the $60,000 mark again in June 2026, briefly touching the $59,100 to $60,200 range and hitting its lowest level since late 2024. This is not an isolated dip. Over the

Trending News
View More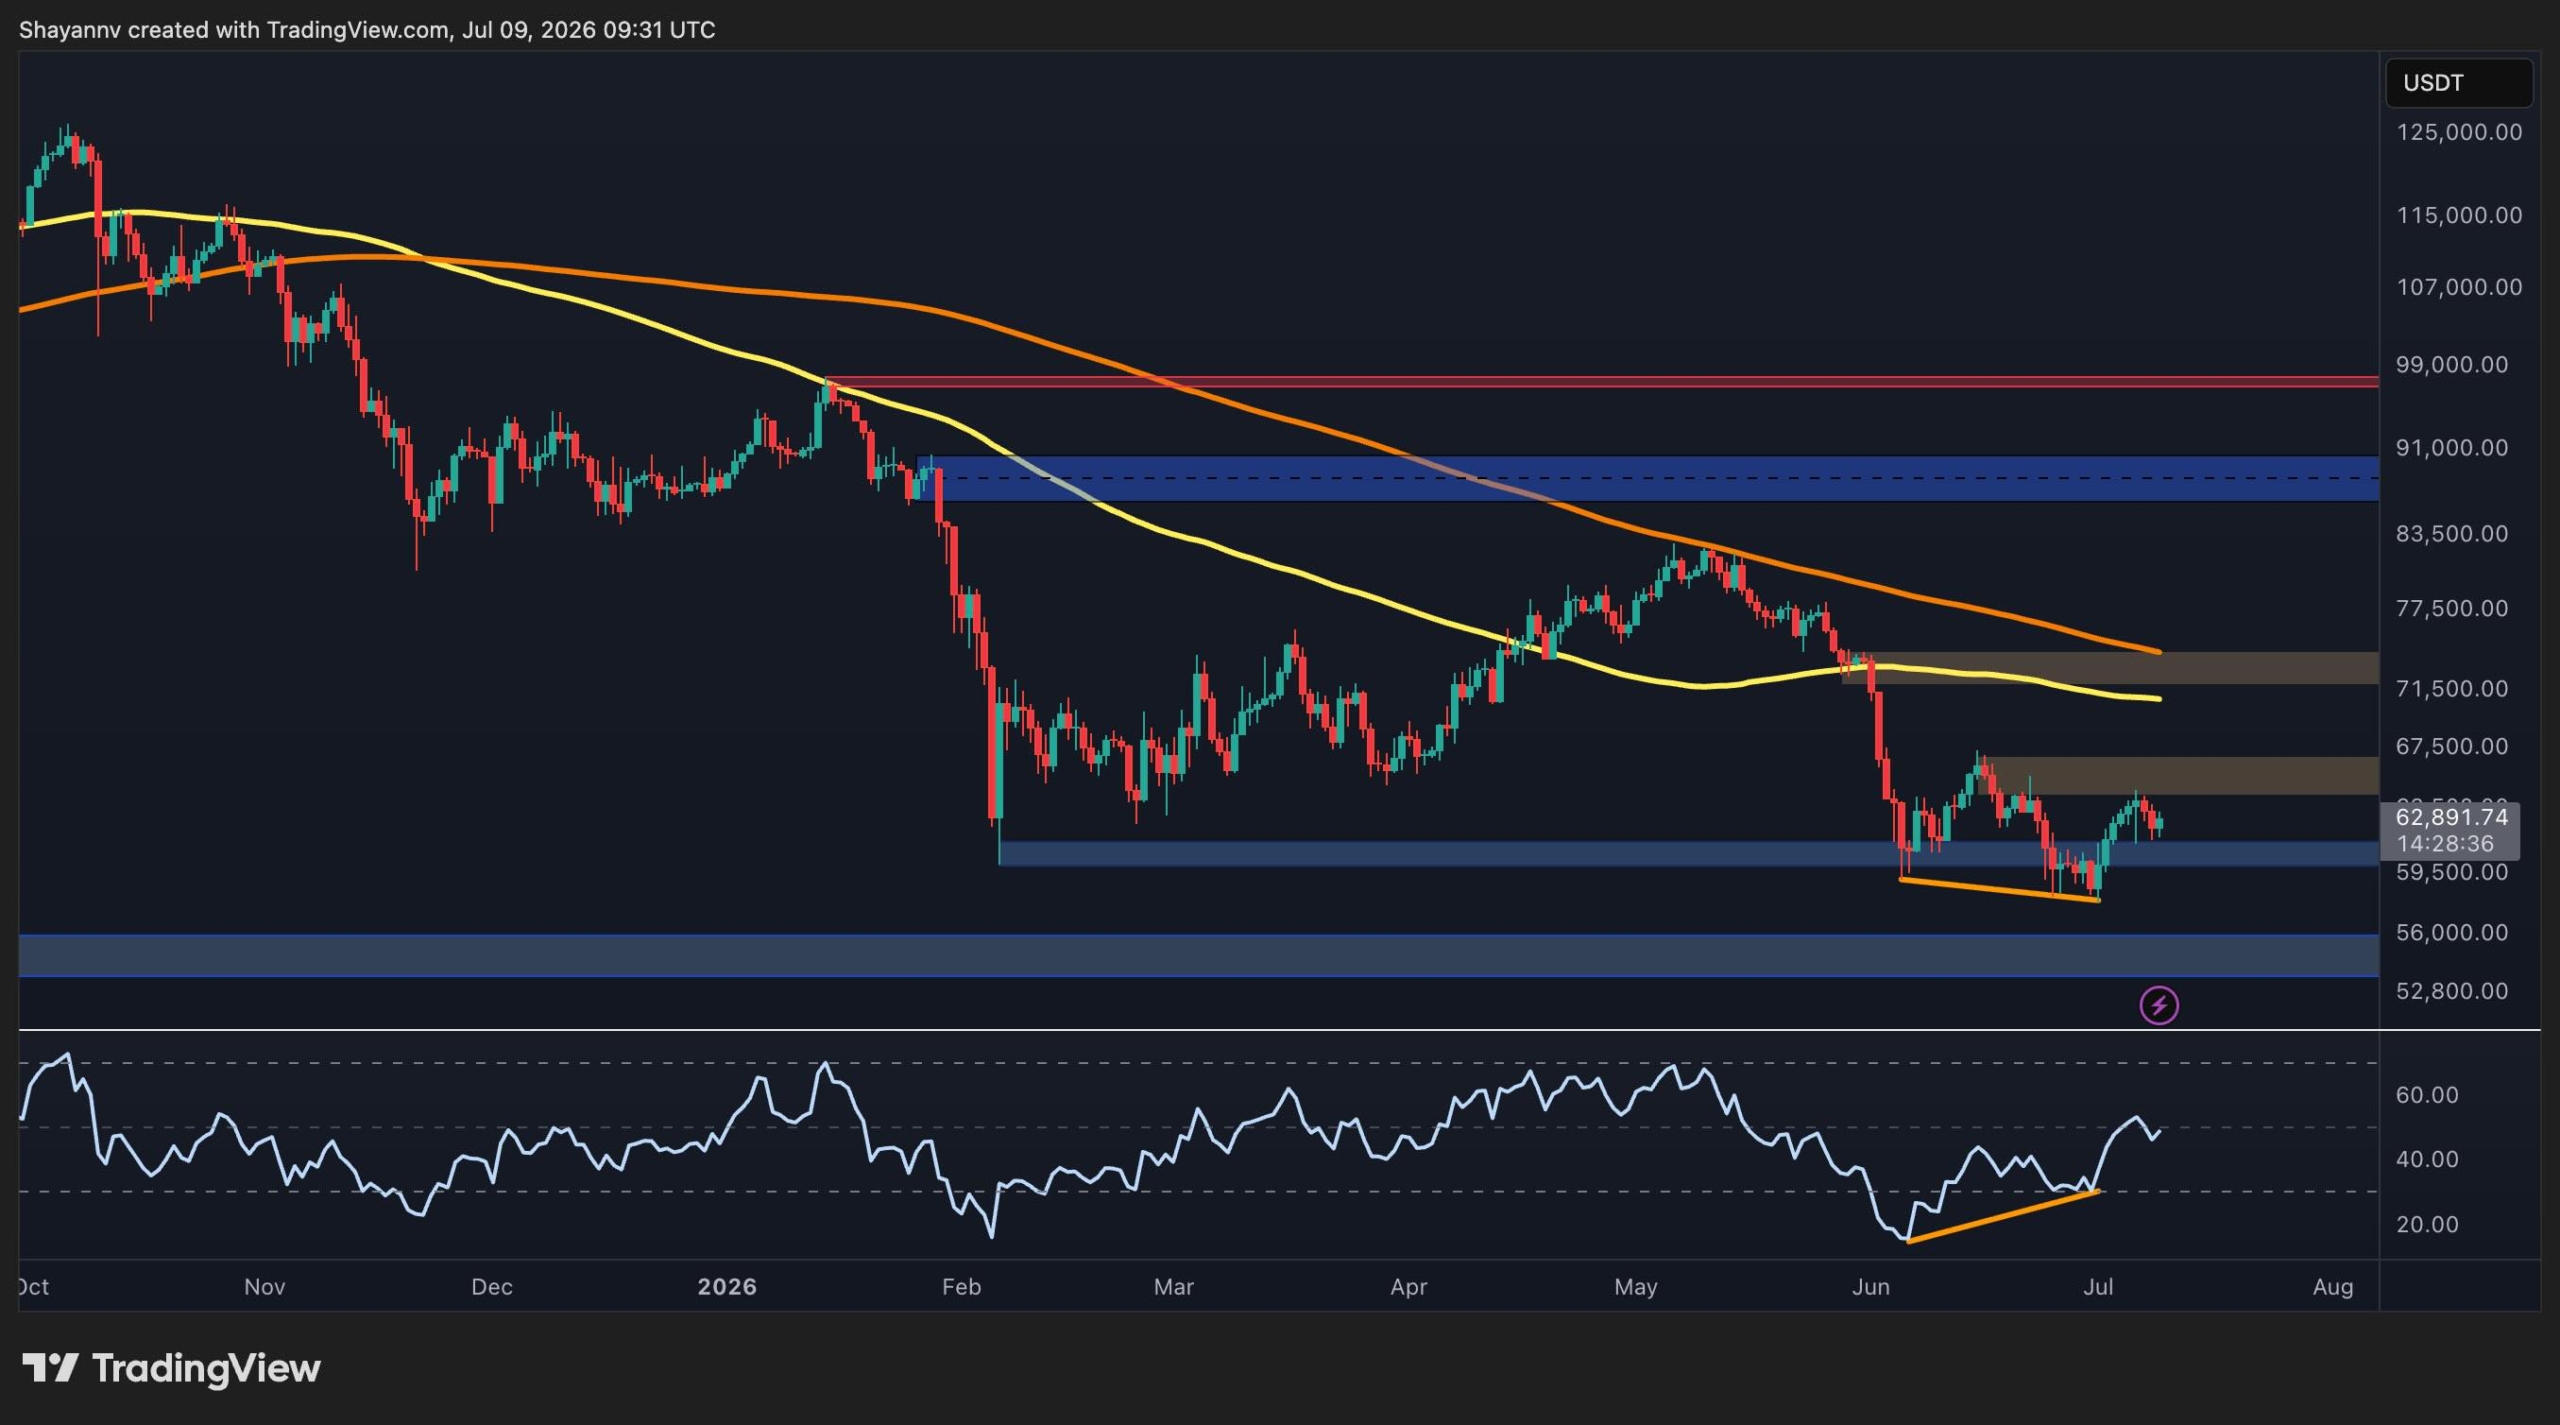
Bitcoin Price Analysis: Has BTC Cleared the Danger Zone After $64K Surge?
Despite showing signs of short-term stabilization above a major support zone, Bitcoin’s downtrend might not be over yet. While momentum has improved on lower timeframes

JPMorgan Says Bitcoin’s Bigger Risk Is Permissioned Blockchains
JPMorgan says Bitcoin's biggest long-term risk isn't Strategy selling BTC—it's the rise of permissioned blockchains that could bypass public chains and crypto


Related Articles
View MoreMEXC Alpha Trader Research Weekly | NFP Sparks a Rebound, but ETF Outflow Pressure Lingers: Can BTC Hold $63,000?
Week 1, July 2026Reporting Period: July 1–7, 2026Data Cutoff: July 7, 2026Core NarrativeOver the past week, the crypto market experienced a dramatic reversal, falling first before staging a strong reb
MEXC Alpha Trader Research Weekly | BTC Falls Below $60K as June ETF Outflows Hit Record Highs: How Far Is the Bottom?
Week 4 of June 2026Reporting period: June 24 – June 30, 2026Data Cutoff: June 30, 2026Core NarrativeOver the past week, the crypto market saw its sharpest sell-off since September 2024. On June 24, Bi

Could Bitcoin Fall to $54,000? Inside the $10.6B BTC Options Gamma Trap
More than $10.6 billion in Bitcoin options are settling today, and the market is not where bulls expected it to be.Traders who spent months positioning for BTC above $80,000 are watching those contrac


