

XRP Price Eyes Rebound as Buy Signals and Momentum Align
TLDR
- XRP price holds above accumulation support, limiting downside risk
- Cleared downside liquidity and negative funding raise rebound potential
- Bullish RSI divergence signals weakening bearish momentuM
- Break above trendline could open targets in the $2.30–$2.60 zone
XRP price is indicating to be in a consolidation phase as multiple technical indicators suggest selling pressure may be easing. Analysts tracking structure, liquidity, and momentum note that the market is approaching a critical inflection point, with upside targets emerging if key levels hold. Current setups point to a potential rebound scenario, provided broader market conditions remain supportive.
XRP Price Holds Above Accumulation Support
According to chart analysis, XRP price is trading within a Wyckoff-style structure that favors bullish continuation. After a prolonged period in a defined accumulation range, price previously transitioned into a sharp mark-up phase. This move confirmed strong institutional demand, with the prior consolidation acting as a reliable base. The current price action reflects a secondary consolidation, where gains are being absorbed.
This structure suggests the market is halting. As long as XRP remains above the established accumulation support, downside risk appears structurally limited. A sustained hold within this range increases the probability of another expansion phase. Even a deeper retracement into support would not invalidate the bullish framework, provided buyers continue to defend the range.
Negative Funding Shift Risk Higher
Meanwhile, another analysis highlights a notable shift in XRP’s derivatives and liquidity landscape. Heatmap data indicate that most downside liquidity below current price levels has already been absorbed. When sell-side liquidity is cleared, further declines typically require increased selling pressure, often resulting in market stabilization or reversal. This development suggests bearish momentum may be weakening.
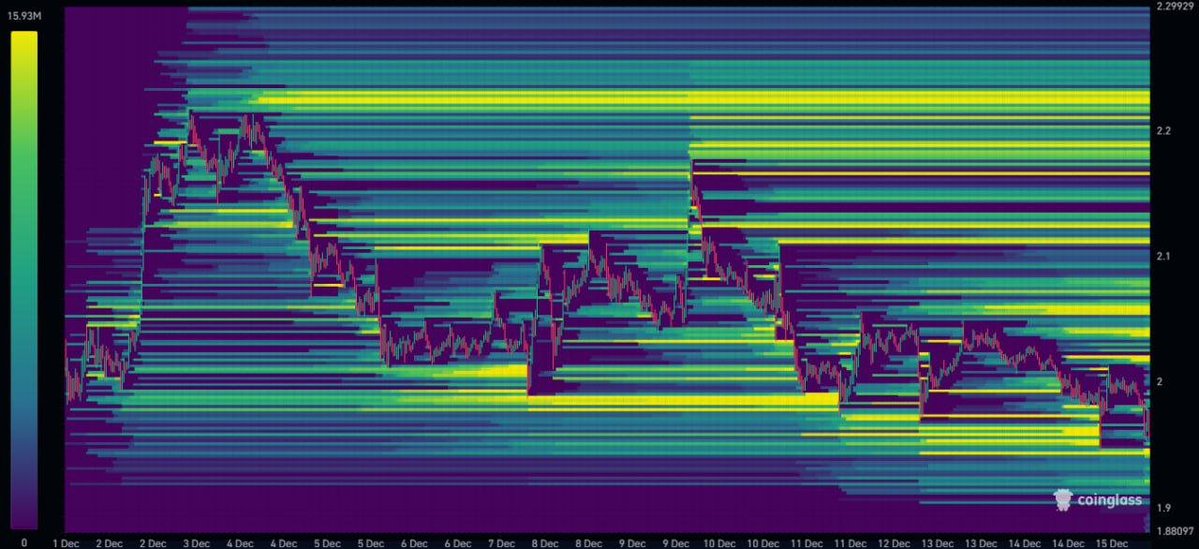
Additionally, funding rates across major exchanges have turned negative, signaling a crowded short environment. Negative funding reflects traders paying to maintain short exposure, a condition that historically increases the risk of upside reactions.
With fewer liquidity clusters overhead, XRP price could experience a swift move higher if shorts are forced to cover, especially during periods of improving market sentiment.
Bullish RSI Divergence Signals Trend Exhaustion
According to the third chart, XRP remains within a descending trend structure, defined by a series of lower highs. Despite this, momentum indicators are beginning to diverge from price. The Relative Strength Index is forming higher lows while price continues to trend lower, creating a clear bullish divergence. This pattern often signals that selling pressure is fading, even before price confirms a reversal.
The descending trendline remains the critical technical barrier. A confirmed daily close above this level would invalidate the bearish structure and signal a trend shift. In that scenario, XRP price could target higher resistance zones in the $2.30 to $2.60 range.
Failure to break the trendline may result in further consolidation, but the divergence suggests downside momentum is increasingly limited.
Moreover, the convergence of accumulation structure, cleared downside liquidity, and weakening bearish momentum places XRP price at a pivotal technical juncture. While confirmation remains necessary, current conditions point toward price stability and a potential upside continuation rather than an extended decline.
The post XRP Price Eyes Rebound as Buy Signals and Momentum Align appeared first on CoinCentral.
Ayrıca Şunları da Beğenebilirsiniz

The Channel Factories We’ve Been Waiting For

SOLANA NETWORK Withstands 6 Tbps DDoS Without Downtime

XRP ETFs pass $1 billion mark with no outflow days since launch
Copy linkX (Twitter)LinkedInFacebookEmail