

HBAR price shows early signs of breakdown as $0.12 support falters
HBAR price weakens as repeated tests of the $0.12 support erode its strength, creating an apex breakout zone that could trigger a deeper correction if bulls fail to defend key levels.
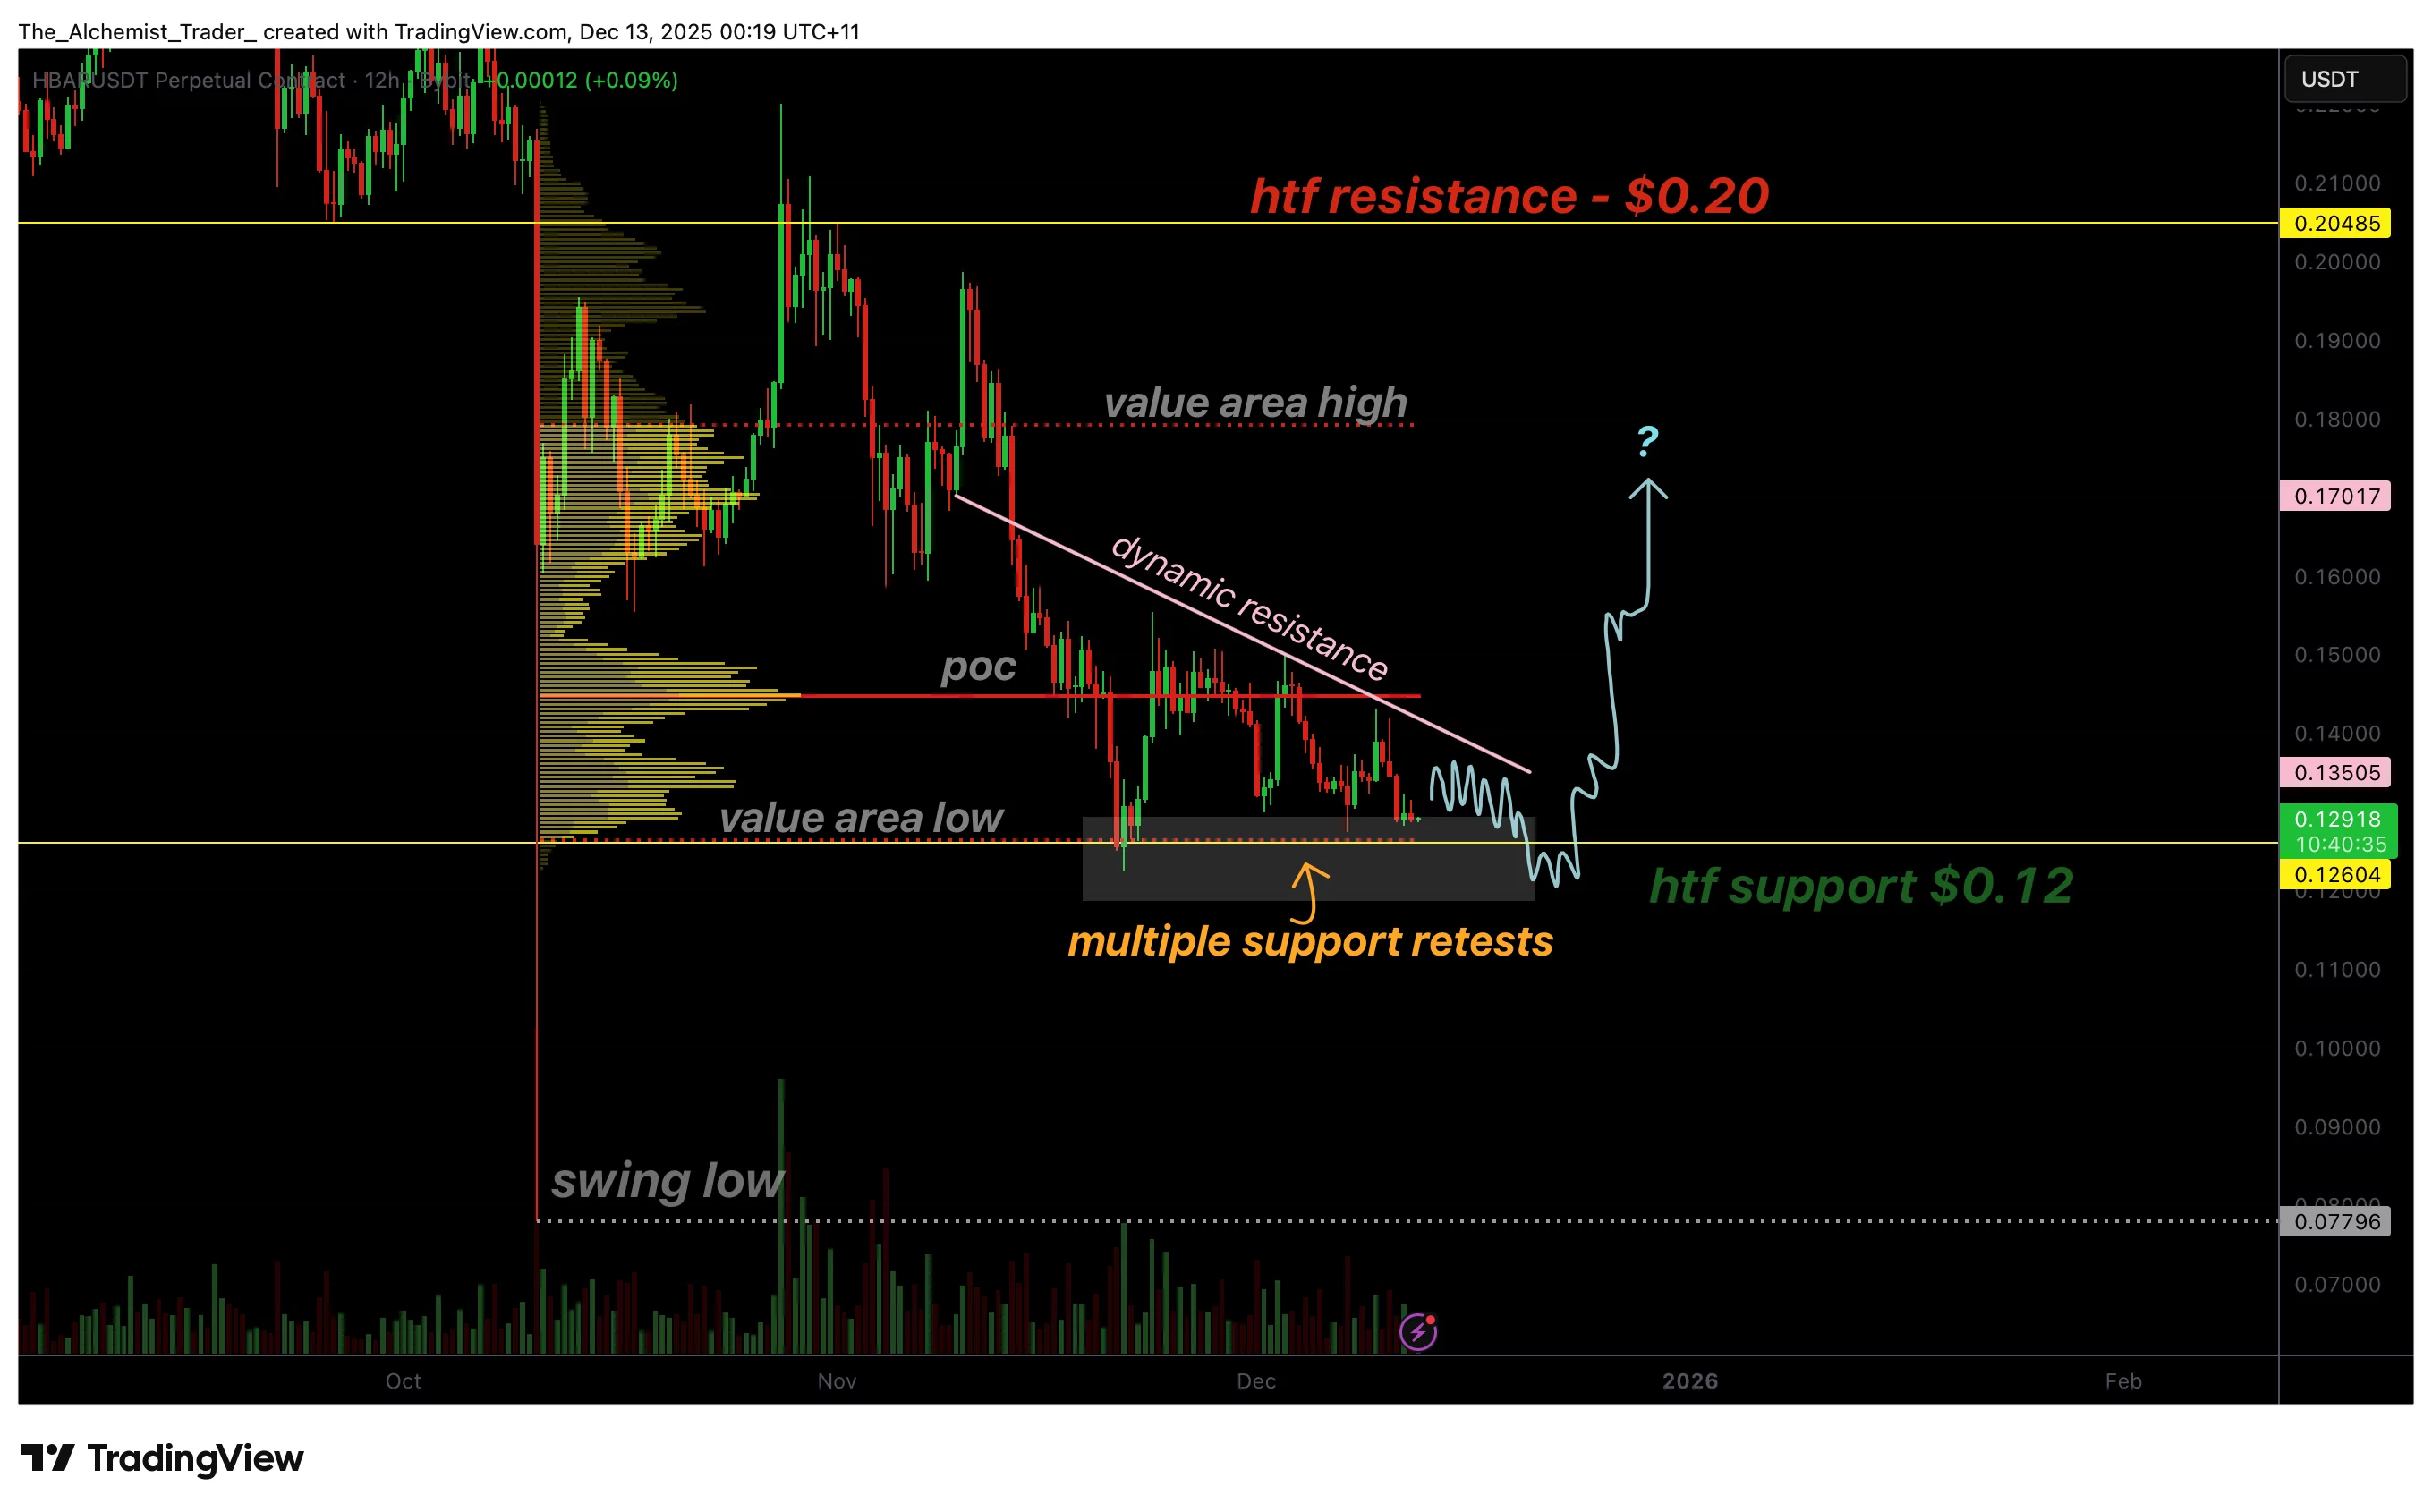
- $0.12 support weakens after multiple retests, increasing downside risk.
- Dynamic resistance compresses price into an apex breakout zone.
- Acceptance below $0.12 opens targets toward lower swing lows.
Hedera Hashgraph (HBAR) is facing mounting downside pressure as its long-standing $0.12 support level approaches exhaustion. Over several weeks, price action has hovered above this critical area, forming a narrow consolidation range that now appears increasingly fragile.
With dynamic resistance compressing the price from above and the support base weakening from below, HBAR is approaching a decisive apex. This zone is likely to determine whether the asset experiences a deeper correction or attempts a bullish breakout driven by renewed momentum.
HBAR price key technical points
- Support at $0.12 has weakened following repeated retests, reducing its structural strength.
- Dynamic resistance is compressing price into an apex, signalling an imminent breakout.
- Acceptance below $0.12 opens the path toward lower swing lows, while a fast reclaim would be required for a bullish reversal.
HBAR’s recent price action has highlighted the importance of the $0.12 support zone, a level that has held the asset steady despite broader market volatility. This area is significant not only structurally, but also because it aligns with the Value Area Low (VAL) in the current volume profile. Historically, this level has acted as a demand zone where buyers have stepped in with conviction.
However, support levels weaken each time they are tested. HBAR has now tapped into the $0.12 region multiple times, forming what many traders refer to as a “fragile floor.” As liquidity continues to build under this level, sellers become increasingly incentivized to test lower territory.
This repeated probing increases the probability of a deeper correction if the level eventually gives way, a risk amplified as HBAR forms a vulnerable price pattern while ETF inflows remain stagnant, signaling weakening external demand.
Adding pressure is the dynamic resistance compressing price from above, creating a tightening range that is pushing HBAR into an apex formation. When price action is squeezed between weakening support and strong resistance, volatility typically expands sharply once the breakout occurs. In the current structure, this expansion could favor the downside, unless buyers reclaim control with a forceful breakout above the descending resistance.
A liquidity grab below $0.12 is also a scenario traders are watching closely. Such a move, often referred to as a failed auction, involves price briefly breaking below support to capture liquidity before snapping back above the level. If this occurs, HBAR must quickly and convincingly reclaim $0.12 to signal strength. A slow or weak reclaim would instead confirm acceptance below the support, marking the start of a deeper corrective move.
If HBAR declines below $0.12, the most probable outcome is a continuation of the downward trend toward the next swing low, which represents both historical support and an area of untapped liquidity. This would return HBAR to a broader corrective structure, consistent with bearish market conditions observed across several altcoin charts.
From a technical standpoint, market structure further supports the possibility of downside continuation. HBAR remains within a framework of lower highs, signaling that upward momentum is limited and sellers remain in control. The inability to overcome dynamic resistance indicates that bulls currently lack the strength to initiate a sustained rally.
What to expect in the coming price action
HBAR is approaching a critical decision point. A clean reclaim of $0.12 followed by a breakout above dynamic resistance could trigger a bullish expansion. However, failure to hold this level would likely confirm a deeper correction toward the next swing low.
Ayrıca Şunları da Beğenebilirsiniz

Those Who Missed XRP Now Eye Apeing ($APEING) as One of 2025’s Next Crypto to Hit $1

Polygon Tops RWA Rankings With $1.1B in Tokenized Assets
