Dogecoin (DOGE) Hangs Above Key Support: Can $0.068 Hold Against the Bears?
- The DOGE price is holding near $0.070.
- Dogecoin sellers maintain firm control.
The dog-themed Dogecoin (DOGE) enters July under pressure as potential bears continue to dictate its direction. It has been attempting to attract the bulls into the charts to escape the downside trading pattern, but it fails.
Also, the technical structure remains firmly negative, as the meme coin continues to trade within a well-established downtrend. The bearish price alignment confirms that sellers continue to dominate the broader market trend of DOGE.
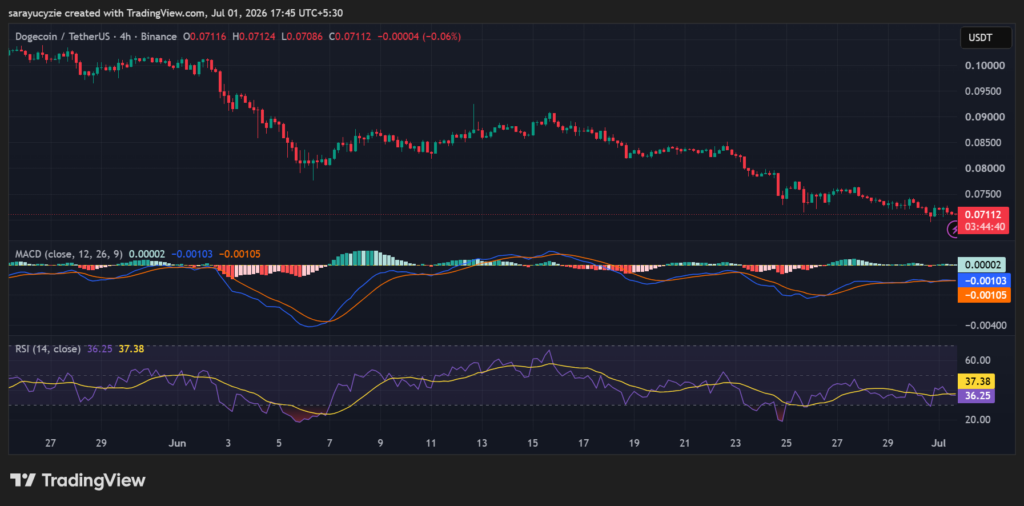
Only when the buyers enter, the momentum flip and turns green. Moreover, Dogecoin is currently trading near the $0.07098 mark after slipping around 1.37% over the last 24 hours, according to CMC data. The price is holding above the daily low noted at $0.06961, and below the daily high of $0.07249.
DOGE’s Key Support and Resistance Levels
Significantly, Dogecoin’s short-term price structure depends on a few important ranges. The immediate support might be at $0.07051, followed by a level below $0.070. A deeper zone observed between $0.06021–$0.05810 are the crucial areas that decide whether the meme coin stabilises or continues to retrace.
On the other hand, the first recovery level of DOGE is likely at $0.07151. The price would need to push through $0.072 to show stronger momentum. A stronger move above $0.08016 confirms that buyers are gaining control. With the next resistance levels sitting near $0.081 and $0.082, the higher targets are aimed to be broken.
Technical Chart Setup Points To Continued Weakness
DOGE’s four-hour chart gives a caution, with the Moving Average Convergence Divergence (MACD) line slightly above the signal line. It suggests that buying momentum is beginning to improve. However, both lines remain below the zero line, so that the broader trend is bearish.
This points to an early recovery attempt, but stronger buying pressure is needed to confirm a shift in the broader market trend.
 (Source: TradingView)
In addition, the daily Relative Strength Index (RSI) is resting at around 36.25, indicating that DOGE is in the bearish territory. But it has moved away from the oversold zone. The selling pressure remains dominant, although it has started to ease.
A move above the neutral level, 50, would signal that the buyers are gaining stronger control of the asset’s price momentum.
Crypto Market Highlights
Frog-Themed PEPE Faces Mounting Pressure: Will Bears Break the Key Neckline?


Ayrıca Şunları da Beğenebilirsiniz

Bayern sign Morocco midfielder Saibari on five-year deal

68% of global BTC miners came from the U.S., Russia, and China, Q1 2026