Gold has slipped below $4,000 for the first time in months. See why analysts are watching key support levels and what could happen next.Gold has slipped below $4,000 for the first time in months. See why analysts are watching key support levels and what could happen next.

Martin Armstrong Says Gold's 30% Correction May Be Nearly Complete—Here's Why

2026/06/29 22:55
Okuma süresi: 4 dk
Bu içerikle ilgili geri bildirim veya endişeleriniz için lütfen crypto.news@mexc.com üzerinden bizimle iletişime geçin.

Key highlights:

  • The gold price fell below $4,000, extending its decline to over 28% from January's high.
  • Martin Armstrong says gold's correction is nearing the 30% pullback his models projected. 
  • Traders are watching $4,024 support as RSI shows a bullish divergence.

Gold is below $4,000 per ounce, which has started discussions on whether the bull market has ended. However, economist Martin Armstrong believes otherwise. On June 24, the spot gold price fell to a low of $3,973.79, which was the first time gold was below the $4,000 level since November 2025.

Gold remained under pressure for the next day, with prices around $3,982.49. From its January high near $5,595, the metal has now fallen by more than 28%, putting it close to the 30% correction Armstrong's computer models had projected.

Armstrong believes this is part of a normal market cycle. His view is that major corrections often shake out investors who bought near the top before the market finds its footing again.

The gold chart still points to a bearish trend

We had a look at the daily Gold chart, and the broader trend has not changed yet. The gold price is trading around $4,040.82, leaving it about 32.7% below the peak near $6,000 shown on the chart. 

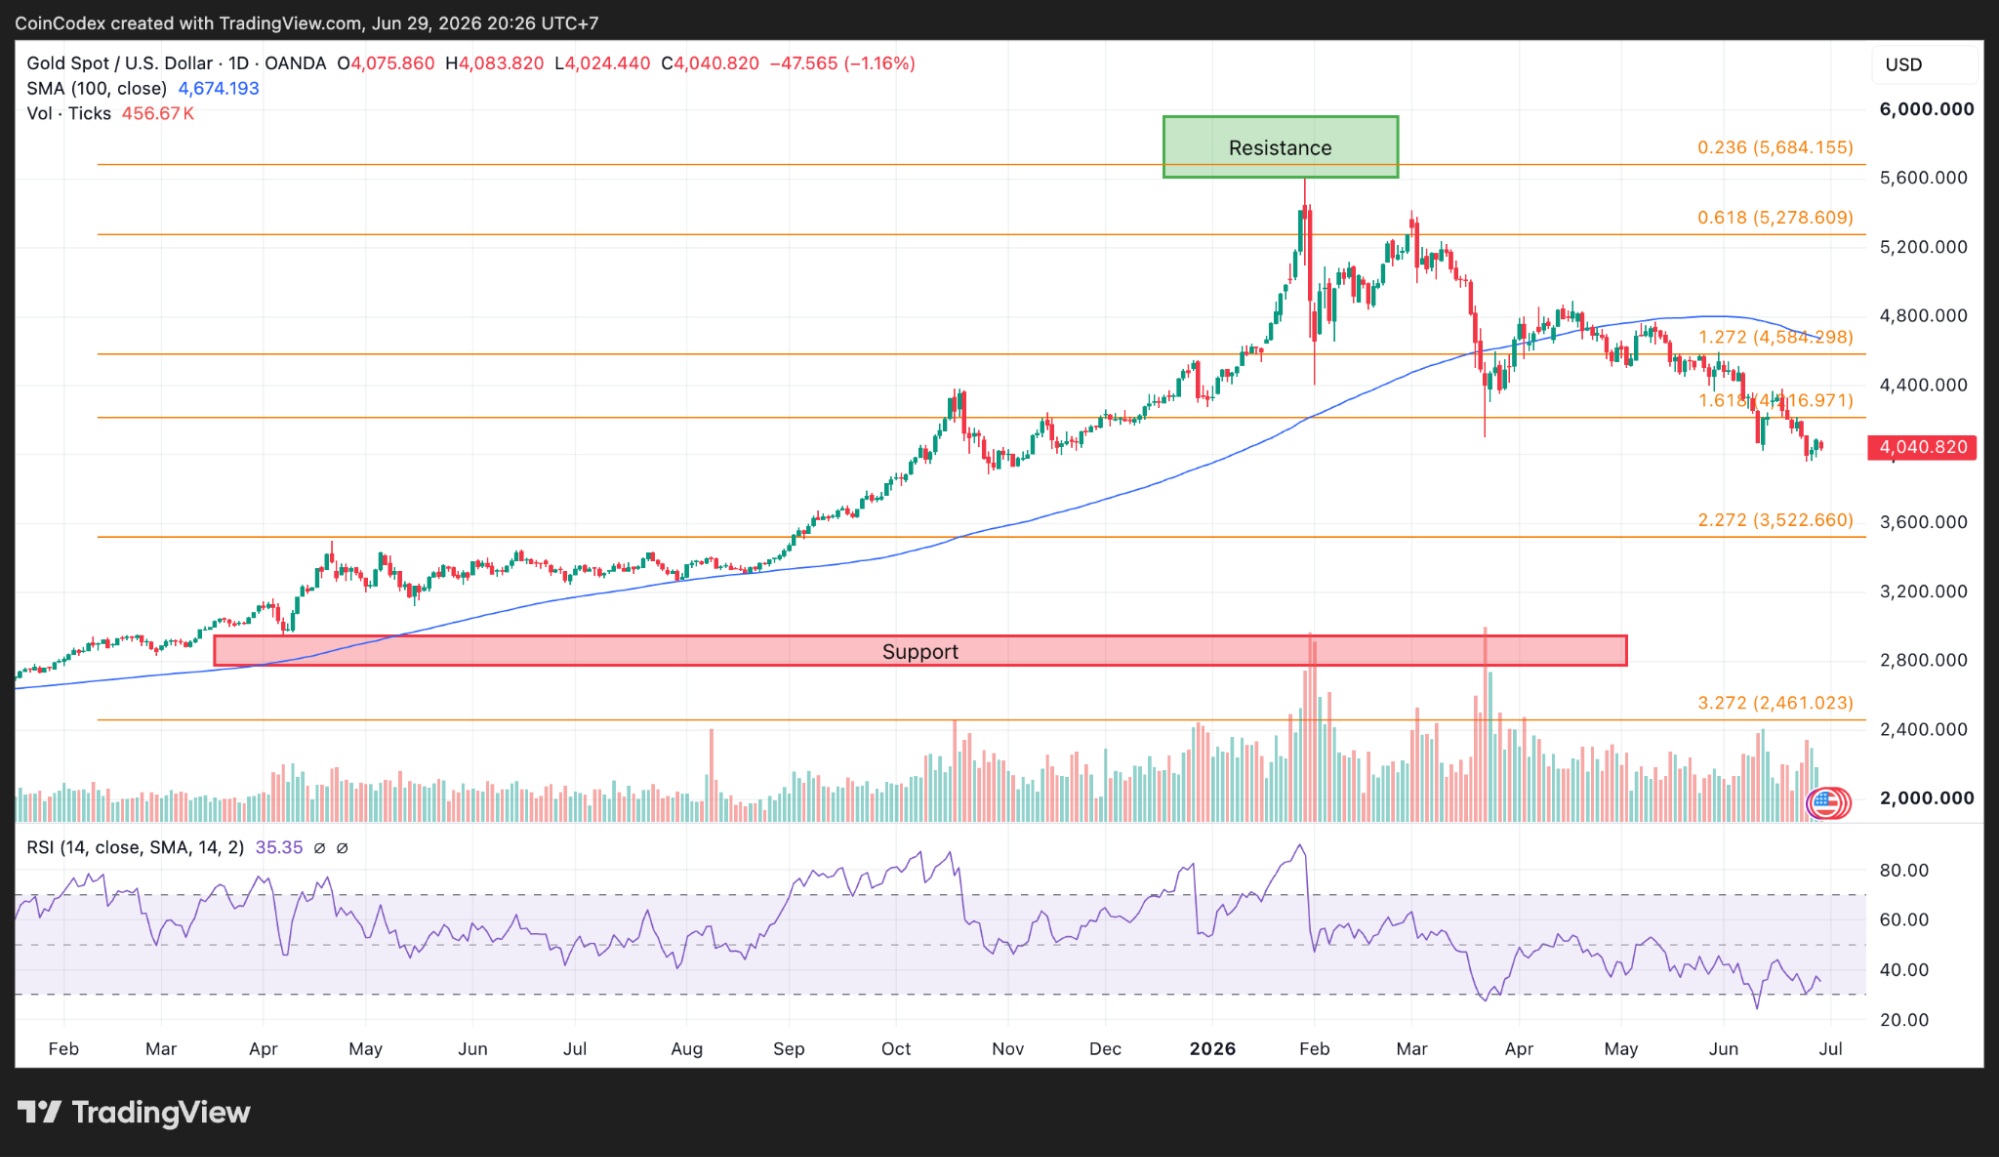
Daily Gold chart analysis

The decline has unfolded in stages. Gold traded near $5,600 in December, dropped to $5,200 in January, moved down to $4,800 in February, then continued sliding through $4,600 and $4,400 before reaching today's levels.

The 100-day simple moving average is at $4,674.19. That puts the gold price roughly 13.5% below the moving average, and the average itself is still moving lower. As long as price stays beneath that level, sellers remain in control of the bigger picture.

Momentum is showing early signs of improvement

The price action remains weak, but one technical indicator is beginning to improve. The daily Relative Strength Index has climbed to 35.35. That remains below the neutral reading of 50, though it is close to the oversold threshold at 30. 

More importantly, RSI has been forming higher lows even as the gold price continued making lower lows. Many traders pay attention to this setup because it often appears before a market begins stabilizing. It does not confirm that a reversal has started, though it does show that selling pressure is becoming less aggressive.

The chart also draws our attention to $4,024 as the first support zone. In case of defending this region by buyers, the next higher targets include $4,200, and then $4,416.97 as the 1.618 Fibonacci level. The 100-day moving average at $4,674 will continue as the key resistance zone.

In case of declining below the $4,024 level, we need to consider $3,900, while the 2.272 Fibonacci extension will come at $3,522.66 becoming the next major support area.

What happens next for the gold price?

Armstrong's comments line up with what the chart is showing. This has been a correction, but strong corrections come after strong rallies. Right now, the gold price is below all key resistance levels, and therefore, the overall bias is in favor of the bears.

It is also important to note that the bulls divergence on the RSI indicates a reduction in bearish momentum. The next few trading sessions should be important. Holding above $4,024 would give buyers an opportunity to challenge resistance near $4,200 and $4,416. A break below support would increase the chances of another move toward $3,900.

According to CoinCodex's 1-month gold price prediction, the price could decline toward $3,708.68, pointing to further downside from current levels if sellers push the metal below the $4,024 support zone and maintain control beneath the 100-day moving average near $4,674.

Piyasa Fırsatı
4 Logosu
4 Fiyatı(4)
$0.008909
$0.008909$0.008909
+1.73%
USD
4 (4) Canlı Fiyat Grafiği

World Cup Combo: Aim for 200x

World Cup Combo: Aim for 200xWorld Cup Combo: Aim for 200x

Combine up to 20 World Cup matches in one order

Sorumluluk Reddi: Bu sitede yeniden yayınlanan makaleler, halka açık platformlardan alınmıştır ve yalnızca bilgilendirme amaçlıdır. MEXC'nin görüşlerini yansıtmayabilir. Tüm hakları telif sahiplerine aittir. Herhangi bir içeriğin üçüncü taraf haklarını ihlal ettiğini düşünüyorsanız, kaldırılması için lütfen crypto.news@mexc.com ile iletişime geçin. MEXC, içeriğin doğruluğu, eksiksizliği veya güncelliği konusunda hiçbir garanti vermez ve sağlanan bilgilere dayalı olarak alınan herhangi bir eylemden sorumlu değildir. İçerik, finansal, yasal veya diğer profesyonel tavsiye niteliğinde değildir ve MEXC tarafından bir tavsiye veya onay olarak değerlendirilmemelidir.

Ayrıca Şunları da Beğenebilirsiniz

Unleashing A New Era Of Seller Empowerment

Unleashing A New Era Of Seller Empowerment

The post Unleashing A New Era Of Seller Empowerment appeared on BitcoinEthereumNews.com. Amazon AI Agent: Unleashing A New Era Of Seller Empowerment Skip to content Home AI News Amazon AI Agent: Unleashing a New Era of Seller Empowerment Source: https://bitcoinworld.co.in/amazon-ai-seller-tools/
Paylaş
BitcoinEthereumNews2025/09/18 00:10
CME Group to launch Solana and XRP futures options in October

CME Group to launch Solana and XRP futures options in October

The post CME Group to launch Solana and XRP futures options in October appeared on BitcoinEthereumNews.com. CME Group is preparing to launch options on SOL and XRP futures next month, giving traders new ways to manage exposure to the two assets.  The contracts are set to go live on October 13, pending regulatory approval, and will come in both standard and micro sizes with expiries offered daily, monthly and quarterly. The new listings mark a major step for CME, which first brought bitcoin futures to market in 2017 and added ether contracts in 2021. Solana and XRP futures have quickly gained traction since their debut earlier this year. CME says more than 540,000 Solana contracts (worth about $22.3 billion), and 370,000 XRP contracts (worth $16.2 billion), have already been traded. Both products hit record trading activity and open interest in August. Market makers including Cumberland and FalconX plan to support the new contracts, arguing that institutional investors want hedging tools beyond bitcoin and ether. CME’s move also highlights the growing demand for regulated ways to access a broader set of digital assets. The launch, which still needs the green light from regulators, follows the end of XRP’s years-long legal fight with the US Securities and Exchange Commission. A federal court ruling in 2023 found that institutional sales of XRP violated securities laws, but programmatic exchange sales did not. The case officially closed in August 2025 after Ripple agreed to pay a $125 million fine, removing one of the biggest uncertainties hanging over the token. This is a developing story. This article was generated with the assistance of AI and reviewed by editor Jeffrey Albus before publication. Get the news in your inbox. Explore Blockworks newsletters: Source: https://blockworks.co/news/cme-group-solana-xrp-futures
Paylaş
BitcoinEthereumNews2025/09/17 23:55
Binance Perpetual Futures Revolution: QQQ and Major US Stocks Enter Crypto Derivatives Market with 10x Leverage

Binance Perpetual Futures Revolution: QQQ and Major US Stocks Enter Crypto Derivatives Market with 10x Leverage

BitcoinWorld Binance Perpetual Futures Revolution: QQQ and Major US Stocks Enter Crypto Derivatives Market with 10x Leverage In a groundbreaking move that bridges
Paylaş
bitcoinworld2026/04/02 18:00