

Wix Stock slips again as oversold signals fail to stop bears

Wix Stock remains under pressure as the primary daily downtrend dominates and rebounds struggle to stick. Oversold signals allow tactical bounces, but fragile sentiment and negative momentum keep the burden of proof on buyers.
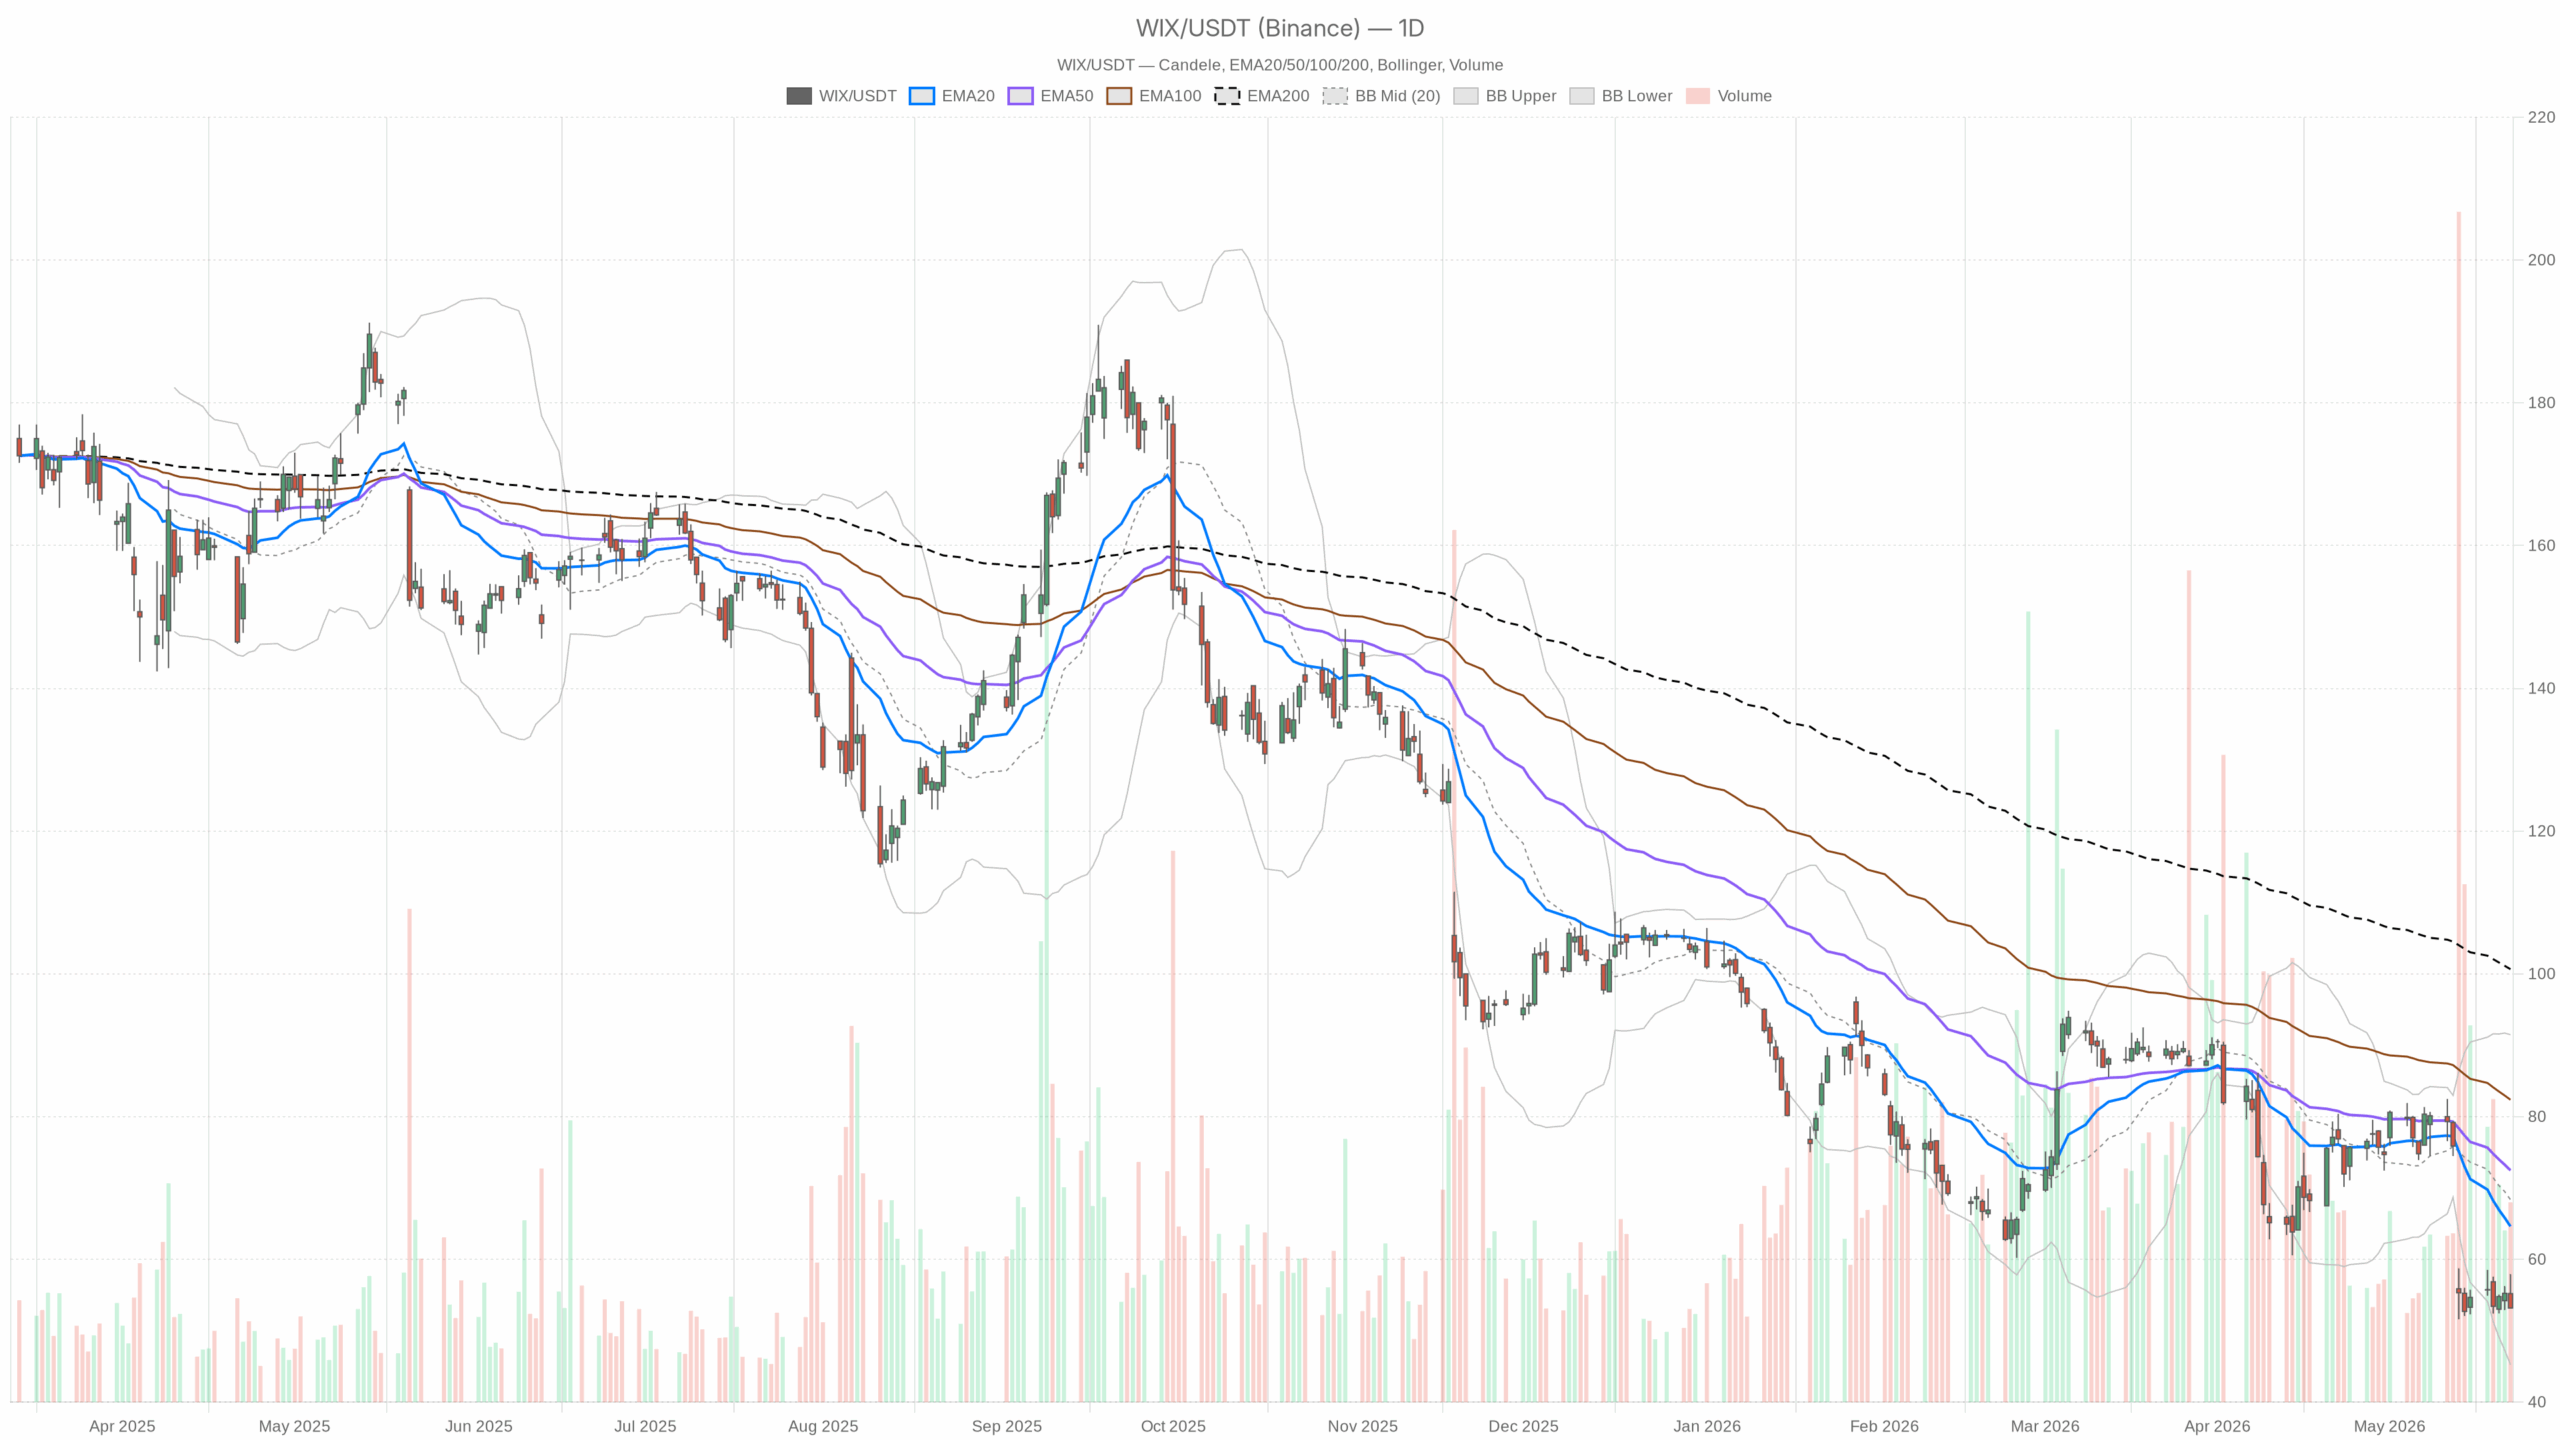 WIX — daily chart with candlesticks, EMA20/EMA50 and volume.
Wix Stock Daily Technical Outlook
Trend and Momentum
On the daily timeframe, WIX closed at 53.19 after a volatile session. The EMA20/EMA50/EMA200 at 64.62/72.47/100.65 sit far above price, preserving a bearish primary bias. The RSI(14) at 31.71 hovers near oversold. That hints at seller fatigue but does not confirm a turn.
Meanwhile, the MACD line at -6.41 with a histogram of -1.75 remains deeply negative. Momentum is still pointed down. Therefore, rallies face a credibility gap until momentum improves.
Volatility, Bands, and Pivots
Bollinger Bands show a mid at 68.37 and a lower band at 45.26; price is anchored in the lower half, so pressure persists with room to wobble before the lower band. The ATR(14) at 5.89 is elevated, signaling wide daily swings and higher position-sizing risk. Meanwhile, the daily pivot at 54.74 with R1 56.38 and S1 51.54 frames the range; a close below the pivot keeps bears in control near term.
Headlines and Sentiment for WIX
Recent headlines skew cautious. A critical view flagged Wix’s buyback and potential margin compression alongside AI headwinds. Sentiment is fragile when the chart is already weak. Another piece highlighted heavier investment in AI and platform growth with dilution risks. That points to an investment phase that can pressure margins.
In contrast, Scotiabank called the selloff significantly overdone while trimming its price target to 110 and keeping Sector Outperform. That offers valuation support but not a timing signal. Notably, a brief tech uplift tied to broader market news was transitory; the chart did not repair in its wake.
1-Hour Intraday View
On the 1-hour chart, bears still have the edge, though the tape is trying to stabilize. Price trades below the EMA20/EMA50/EMA200 at 54.25/56.73/67.66, so intraday trend pressure remains down. The RSI(14) at 39.78 has edged off extremes. That is early stabilization, not strength.
Meanwhile, the MACD sits near its signal with a flat histogram around 0; momentum is pausing rather than turning. Bollinger Bands center on 54.26 with a lower band at 52.91, and price hugging the lower band reflects persistent supply. The ATR(14) at 1.11 is moderate; volatility is contained but conviction is limited. The hourly pivot at 53.34 with R1 53.57 and S1 52.90 is tight. Trading beneath the pivot keeps sellers pressing, while a reclaim would only start to neutralize pressure.
15-Minute Execution Context
At the 15-minute level, the market leans heavy but sits near near-term supports. Price is below the EMA20/EMA50/EMA200 at 53.91/54.20/57.36, so the micro-trend is down. The RSI(14) at 36.84 is soft, and dip-buyers have not forced a turn.
In addition, the MACD is slightly negative with a small histogram, so momentum bleeds lower. Bollinger Bands center on 53.80 with a lower band at 53.20; price near the lower band leaves room for a squeeze toward the mid if buyers show. The ATR(14) at 0.33 indicates modest bar-to-bar risk. The intraday pivot at 53.30 with S1 52.94 gives crisp levels; holding above 52.94 would help prevent a slide into daily supports.
Base Case and Tactical Bias for Wix Stock
Therefore, the base case stays bearish on the daily trend, with the 1-hour showing only a tentative pause. Until WIX can reclaim and hold the daily pivot at 54.74, bounces should be treated as countertrend. The mix of weak trend, negative daily momentum, and only modest intraday stabilization argues for patience on directional bets.
Bullish and Bearish Scenarios
Bullish scenario:
- First, push back above the 1H pivot 53.34 and the 1H EMA20 at 54.25 to show demand absorbing supply.
- Then regain the daily pivot 54.74 and press toward daily R1 at 56.38 to open room to test the hourly EMA50 near 56.73.
- Corroboration would include a rising 1H RSI through the mid-40s/50s and a positive 1H MACD histogram.
- On the daily chart, look for MACD histogram contraction and the RSI lifting away from 30.
- The daily EMA20 at 64.62 is the larger cap overhead; reaching it would likely require multiple sessions of repair.
Bearish scenario:
- A clean break below 52.90–52.94 (1H S1 and 15m S1) would put the daily S1 at 51.54 in play.
- In turn, losing 51.54 on a closing basis would confirm trend persistence.
- With the daily MACD already negative and the ATR high, follow-through could be sharp.
- In that case, the daily Bollinger lower band at 45.26 becomes the next mechanical downside marker.
- Proximity to that band would then raise the prospect of a reflex bounce.
Conclusion: Wix Stock Outlook
Overall, Wix Stock trades in a bearish regime with oversold undercurrents and conflicting headlines. Positioning should respect the elevated ATR and the fact that key moving averages tower overhead. Until the daily pivot is retaken and intraday momentum improves, volatility favors fades into resistance rather than trend shifts. If 51.54 holds, dip-bulls earn a window; if it breaks, the path of least resistance remains lower.


Ayrıca Şunları da Beğenebilirsiniz

PMI-ACP Exam Preparation: How to Use a Simulator and Practice Questions Effectively

Rubio presidency would be an 'unmitigated disaster': conservative insider

DBP Q1 income up 26%


Popüler Haberler
Daha fazla
