

Fear index 30, 58.3% BTC dominance cap Shiba Inu price relief rally

As risk sentiment remains defensive, the Shiba Inu price sits between a bearish daily backdrop and a tentative intraday rebound. Market fear at 30 and Bitcoin dominance near 58.3% are crowding liquidity into majors.
Thesis — The Shiba Inu price is stuck between a bearish daily backdrop and a tentative intraday rebound. With the broader crypto market in fear (index 30) and Bitcoin dominance elevated near 58.3%, liquidity is crowding into majors and away from high-beta memes. That is the dominant force: a defensive market structure where rallies on SHIB face quicker profit-taking and thinner follow-through.
However, this moment matters because intraday bids are improving even as the daily bias remains southbound. If those bids can graduate into higher-timeframe acceptance, we have room for a relief leg. If not, the prevailing downtrend will simply reload at better prices.
Meanwhile, as of 25 May 2026, the fear index reads 30 and Bitcoin dominance hovers near 58.3%.
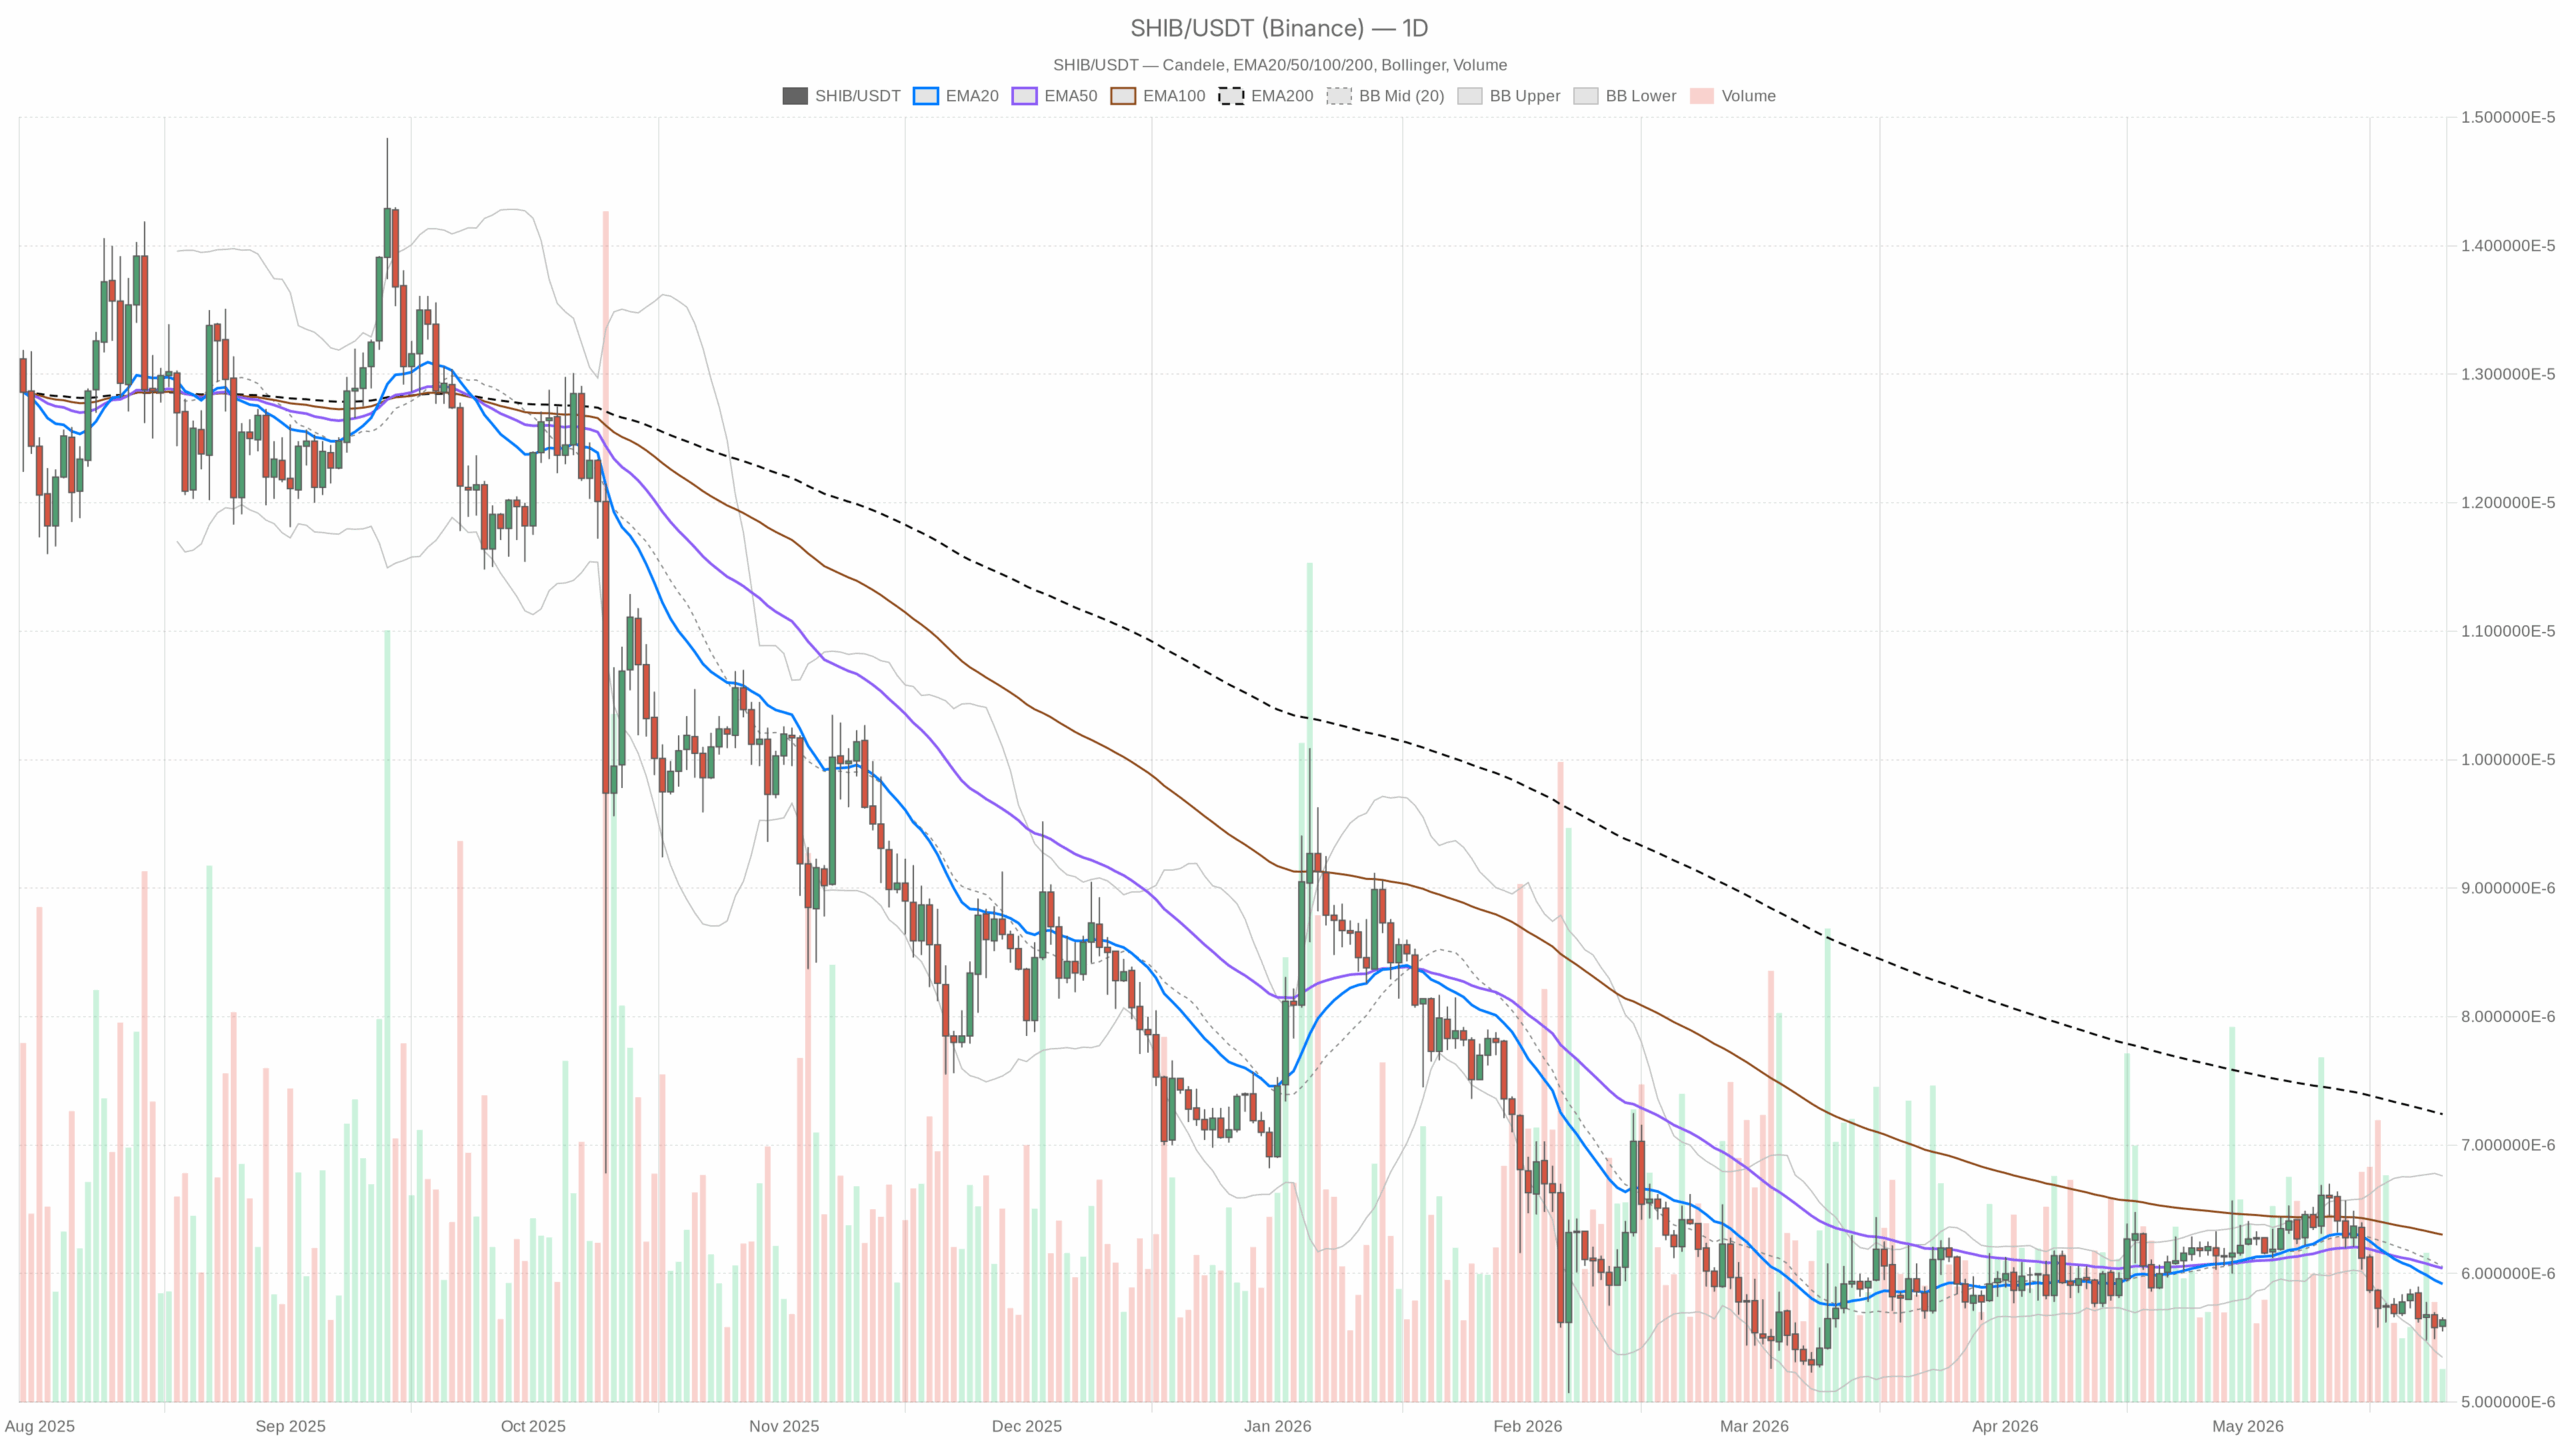 SHIB/USDT — daily chart with candlesticks, EMA20/EMA50 and volume.
Market logic
- Trends vs. mean reversion: Daily trend pressure is down, so bounces are countertrend. Intraday mean reversion is trying to squeeze higher, but it needs daily validation to shift the tape.
- Momentum vs. structure: Momentum on the daily is weak; structure favors lower highs and lows. However, without a structural break, the intraday edge remains fragile.
- Risk appetite vs. defense: Fear is back, volumes are lighter, and DEX fee activity has cooled across majors. Moreover, this risk-off mix typically caps upside on SHIB and exaggerates pullbacks.
Multi-timeframe view
Daily (macro bias): Bearish regime. Sellers still have the initiative; any bounce is guilty until it proves otherwise by reclaiming higher-timeframe levels.
1H (tactical): Neutral. However, buyers are probing, but they have not forced a clear trend shift. Good for scalps, not conviction yet.
15m (execution): Neutral. It is constructive for managing entries and exits, but it only matters if the 1H confirms.
Indicator check (used as evidence, not as a checklist)
RSI — Daily RSI at 37.9 shows bearish momentum but not a washout; expect rallies to meet supply quickly unless this lifts through the midline. 1H RSI at 55.0 backs a short-term squeeze attempt. 15m RSI at 57.3 supports intraday follow-through but is prone to quick fades without higher-timeframe sponsorship.
MACD — No clear higher-timeframe bull trigger; momentum has not flipped decisively. That keeps the burden of proof on buyers.
EMAs (20/50/200) — With the daily regime bearish, price is likely sitting beneath the key EMA stack. Until SHIB reclaims and holds above that cluster on daily closes, upside is a rally within a downtrend, not a trend change.
Bollinger Bands — In a corrective tape, price tends to lean into the lower half of the bands. Expect rejection pressure on pushes into the mid-band unless momentum improves.
ATR/Volatility — The broader market’s lighter activity and risk-off tone imply two-way chop with air pockets. Therefore, position sizing should respect the potential for abrupt wicks.
Pivots/Levels — Treat recent swing highs as supply and the latest higher intraday lows as your line in the sand. Acceptance above the former signals potential trend repair; loss of the latter hands control back to sellers.
Scenarios and invalidation
Bullish: Intraday squeeze extends, the 1H prints higher highs and holds a higher low, then the daily closes back above the nearest EMA cluster. That would convert today’s bounce into a bona fide relief leg with room to test prior distribution zones. Invalidation: a 1H close back below the most recent higher low. Or a failed retest that instantly rejects from resistance, dragging RSI back under 50 on 1H.
Bearish: Intraday strength stalls under supply, the 1H rolls over, and the daily RSI remains sub-50. That opens a path to sweep recent lows and continue the lower-high, lower-low sequence. Invalidation: firm 1H acceptance above resistance with follow-through. No immediate fade, and daily momentum lifting toward or through the midpoint.
How to think about positioning
The daily chart still calls the shots: treat longs as countertrend trades until proven otherwise. If you’re leaning bullish, keep entries tight on the 15m and demand 1H confirmation before sizing up.
If you’re leaning bearish, fade into strength rather than chasing weakness, because intraday squeezes can be sharp in a fearful market. Overall risk remains elevated: reduced liquidity, high BTC dominance, and muted risk appetite can turn small catalysts into outsized moves. Size conservatively, use hard stops, and be willing to step aside if timeframes disagree.
In sum, the higher timeframe bias stays cautious while intraday momentum attempts a bounce. EMA cluster reclamation on daily closes would confirm any relief leg; otherwise, sellers keep control.


Ayrıca Şunları da Beğenebilirsiniz

Chainlink Whale Activity Rises While Price Bleeds for 7 Straight Months

Treasury’s first GENIUS rule tightens Washington’s grip on who can scale stablecoins

Franklin Templeton CEO Dismisses 50bps Rate Cut Ahead FOMC


Popüler Haberler
Daha fazla
