

SoftBank Stock jumps 30% in 2 days as rally hits resistance

SoftBank Stock (SFTBY) remains in a forceful daily uptrend after an AI-driven surge, yet price is pressing into short-term resistance. The base case stays bullish on the daily timeframe, but the setup looks stretched and prone to consolidation before any next leg higher.
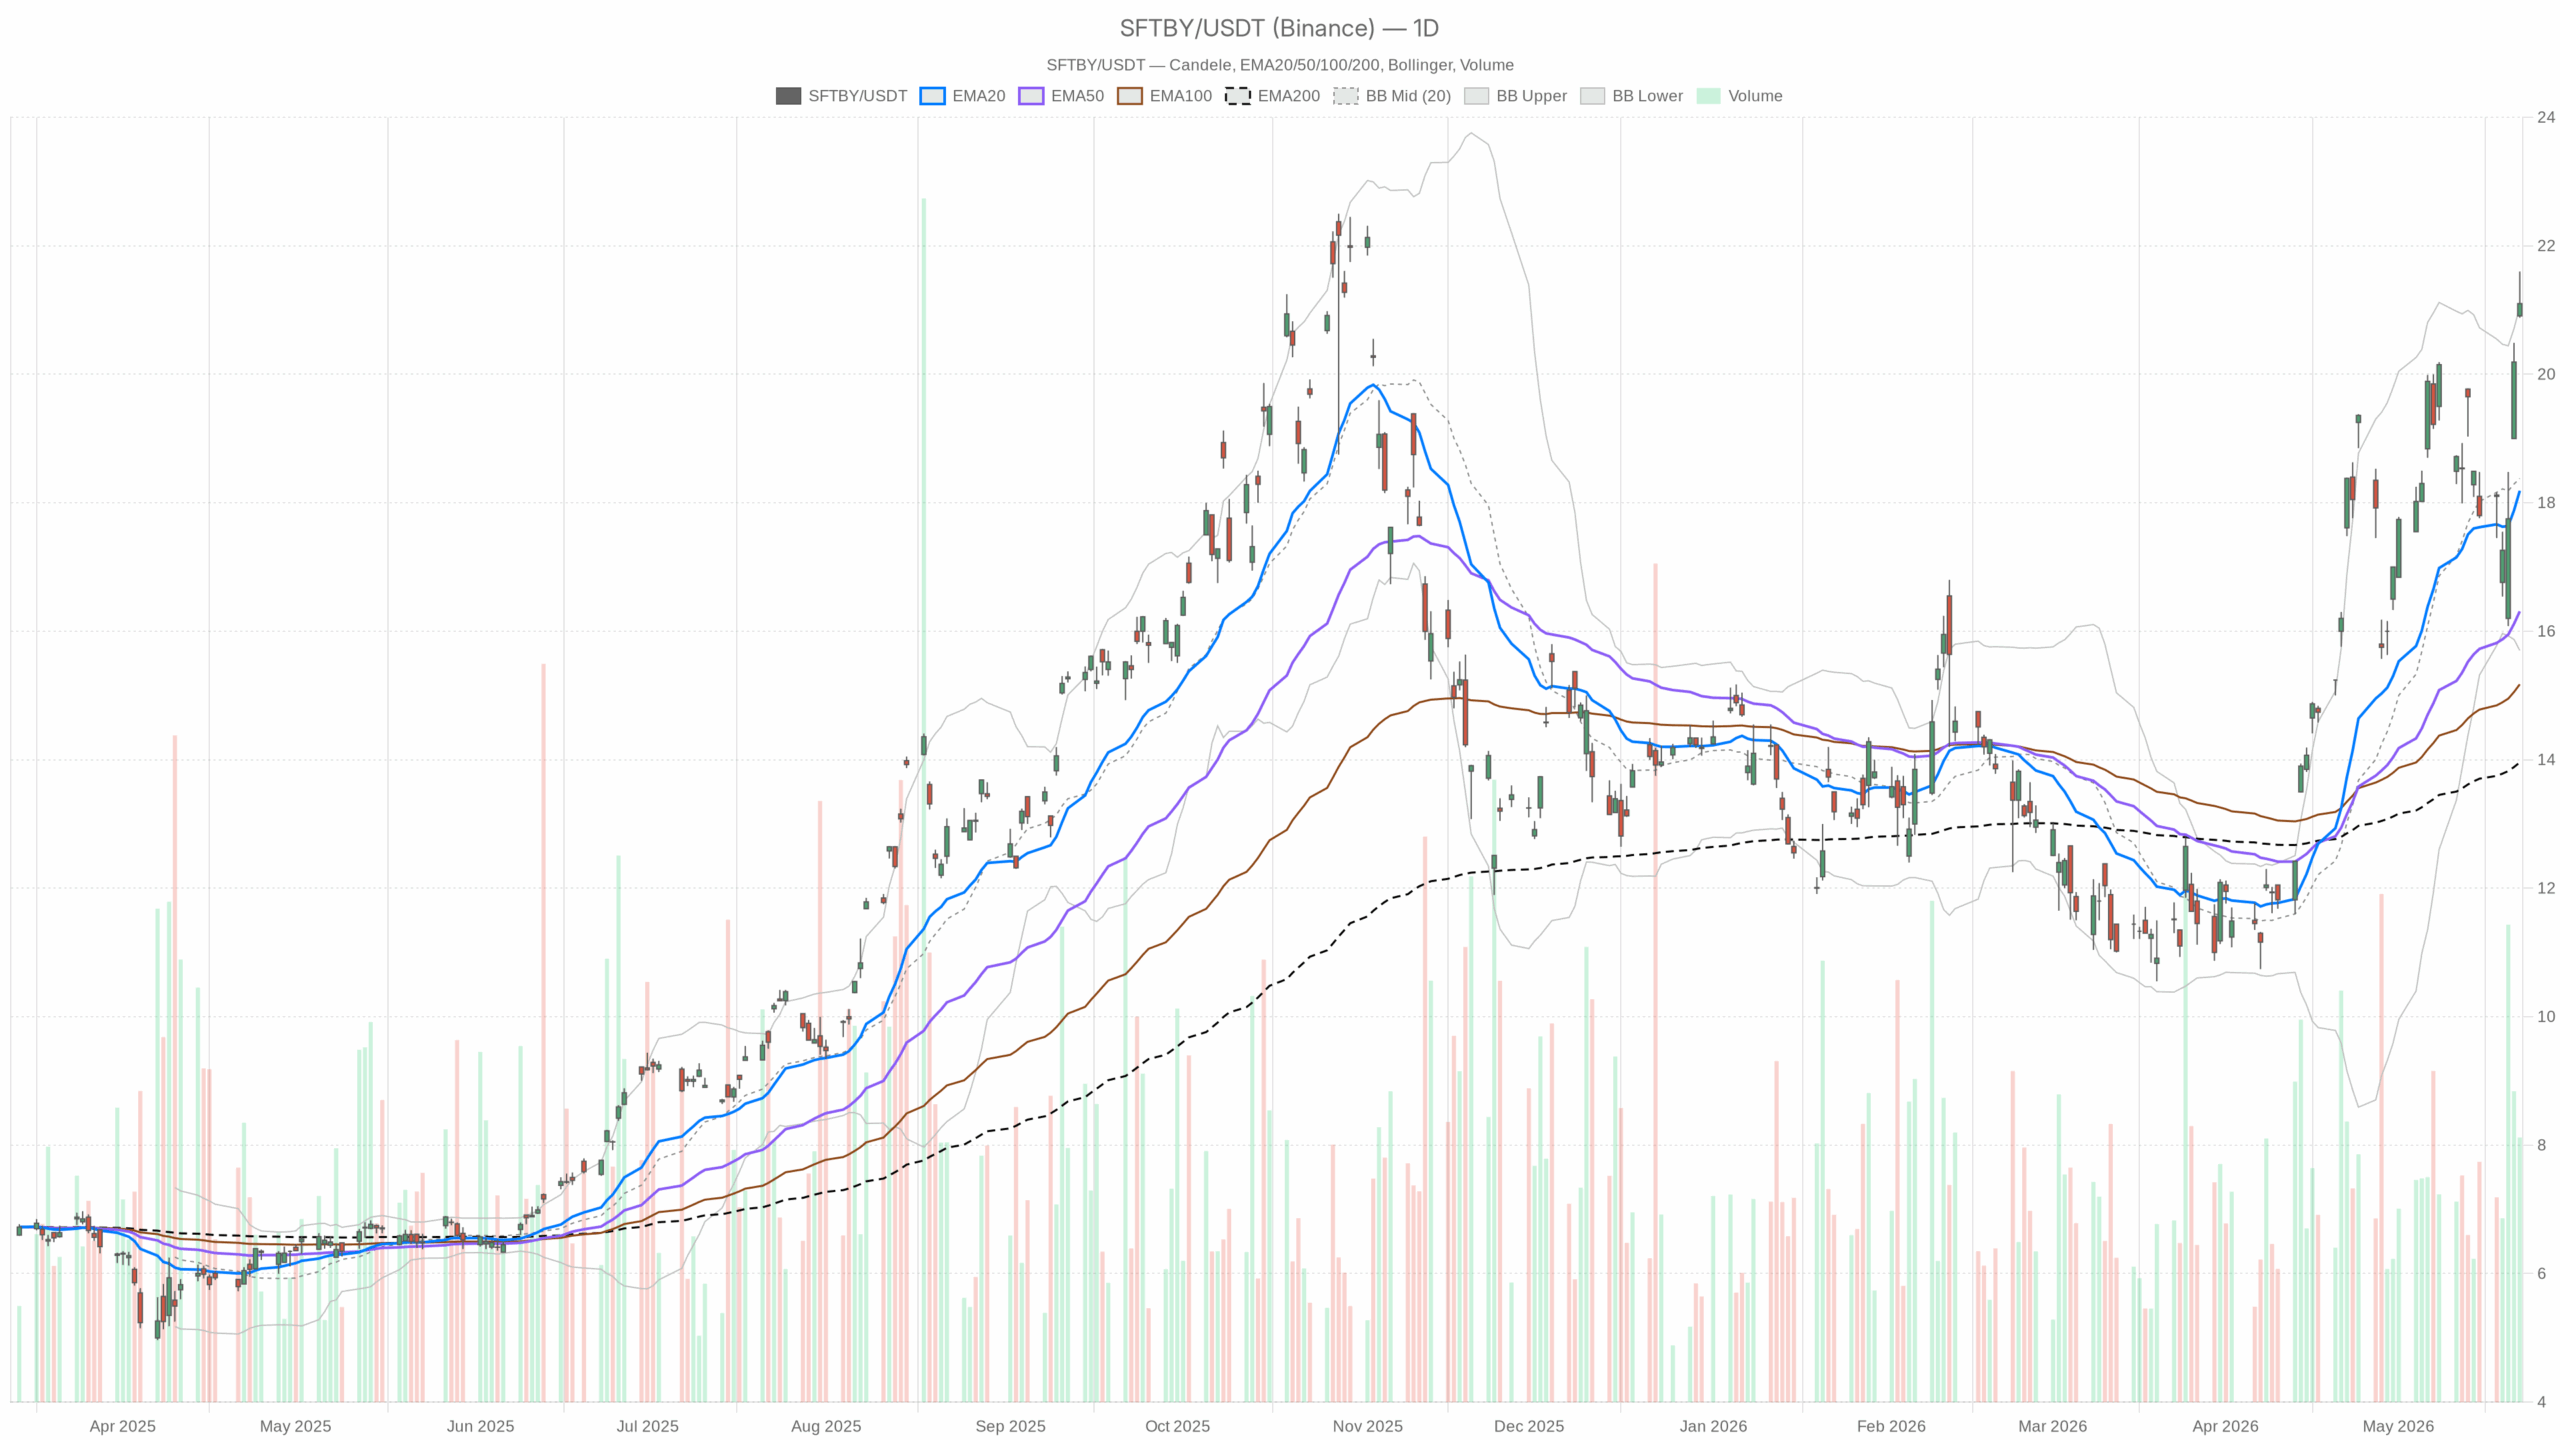 SFTBY — daily chart with candlesticks, EMA20/EMA50 and volume.
SoftBank Stock news and volatility context
Notably, headlines have amplified the move for SoftBank Stock. Yahoo Finance reported that SoftBank shares jumped more than 30% in two days as OpenAI readies a historic IPO. This flow aligns with the spike in momentum and volatility visible on the SFTBY chart.
Daily timeframe: strong trend, momentum pause
On the daily chart, SFTBY closed at 21.10. EMA20/50/200 at 18.19/16.31/13.96 sit well below price. Therefore, the trend is decisively higher and extended.
RSI(14) is 65.01. Momentum is firm but not overbought. MACD line at 1.11 versus signal 1.15, with a histogram of -0.03, shows upside momentum pausing as the rally cools.
Bollinger Bands center on 18.38 with upper/lower at 21.06/15.70, and price near the upper band. Therefore, consolidation risk is elevated. ATR(14) stands at 1.37, confirming high daily volatility after the spike.
The daily pivot sits at 21.19 with R1 at 21.51 and S1 at 20.79. The close is just below the pivot, making 21.19 immediate resistance and 20.79 first support. Regime is tagged bullish; the main bias remains up.
1H timeframe: intraday trend supports the bias
Meanwhile, the 1H view broadly confirms the daily read. Price closed at 21.01. EMA20/50/200 at 20.07/19.15/17.38 remain below price, so the intraday trend is up.
RSI(14) prints 65.2, keeping buyers in control. The MACD histogram is positive at 0.12, so momentum is still building on the hour chart.
Bollinger mid is 19.78 with a wide 22.64/16.92 envelope. Volatility is elevated intraday as well. ATR(14) at 0.58 signals wide hourly ranges.
The hourly pivot is 21.06 with R1 at 21.11 and S1 at 20.96. Price slipped just under the pivot, a minor pullback beneath near-term resistance. Regime remains bullish.
15-minute view: tactical hesitation
In contrast, the 15m execution view shows short-term hesitation. Price closed at 21.01. EMA20 at 21.17 sits above price, so a micro pullback is underway.
RSI(14) is 47.8, keeping momentum neutral at the very short term. The MACD histogram is -0.11, indicating micro momentum is fading.
Bollinger mid is 21.33 with 21.60/21.07 bands, and price is slightly below the lower band. Thus, the move is stretched lower intraday and can snap back. ATR(14) at 0.09 shows contracted very short-term ranges.
The pivot is 21.05 with R1 at 21.09 and S1 at 20.97. Price sits near S1, a local pivot zone where either a bounce or a clean breakdown can trigger. Regime is neutral; the 15m view is tactical rather than directional.
Scenarios for SoftBank Stock: pivots 21.19/20.79
Therefore, the main scenario is bullish but expects digestion before continuation. A reclaim and hold above the hourly pivot cluster at 21.06–21.11, followed by a daily close back above 21.19, would keep the uptrend orderly.
Supporting evidence would include the 1H RSI holding above 60 and the 1H MACD histogram staying positive. A daily MACD histogram turn back above zero would add confirmation. A push through daily R1 at 21.51 would then open room for follow‑through in the SFTBY stock price.
On the other hand, the bullish case weakens if price fails to regain 21.06–21.19 and instead loses support at 20.96 on 1H and 20.79 on the daily pivot map. That would flag a deeper mean reversion toward the daily Bollinger mid near 18.38.
Confirming evidence would be a daily RSI slip toward the mid‑50s and a deeper negative daily MACD histogram, combined with sustained closes below the daily pivot.
Bottom line: bullish bias, manage volatility
At the same time, signals are mixed across very short‑term and higher timeframes. The daily and 1H trends are bullish, but the 15m pullback complicates timing for entries. That conflict leans to consolidation or a shallow dip before buyers attempt another try.
Overall, positioning remains pro‑bull but volatility is elevated. The daily uptrend is intact, yet proximity to the upper Bollinger band and a slight daily MACD pause argue for patience around pivots. With SFTBY technical analysis leaning higher and news‑driven momentum in play, expect wider ranges and faster shifts in micro structure until the market digests the recent spike.


Ayrıca Şunları da Beğenebilirsiniz

Monero (XMR) Price Prediction 2026-2030: Can Privacy Coins Lead the Next Crypto Bull Run?

Crypto Market Drops as Fear Grows and Major Assets Decline

Three Dividend Champions for 2026: Coca-Cola (KO), Philip Morris (PM), and Costco (COST) Lead the Pack


Popüler Haberler
Daha fazla
