

Dogecoin Mirrors Past Cycles as New Accumulation Phase Fuels Bullish Momentum Up
Dogecoin trades near $0.1026 as traders track $0.10 support, RSI at 44, weak MACD momentum, and $0.15 resistance.
Dogecoin traded near $0.1026 as the DOGE/USD chart stayed close to long-term support.
Traders tracked the monthly structure after repeated failed recovery attempts.
Price continued moving sideways within a broad range, while market analysts watched whether the $0.10 area could hold and support a stronger recovery.
Dogecoin Enters a Familiar Monthly Setup
Dogecoin is trading near a key long-term area after a wide decline from prior cycle highs.
The monthly chart shows a broad base, with price moving sideways after repeated failed rallies. This type of structure has appeared in earlier DOGE cycles.
Market analysts often compare the current range with the 2015–2017 and 2019–2020 phases.
In both periods, DOGE spent time in accumulation before stronger upside moves followed. Traders now view the 2025–2027 window as another possible cycle stage.
The current price sits close to the $0.10 level. This area is both psychological support and a technical decision zone. A steady hold above it may help buyers defend the wider range.
However, the chart has not yet confirmed a full trend reversal. DOGE remains below several resistance zones. Price also continues to trade under levels that stopped earlier recovery attempts.
Support and Resistance Shape the Market View
The nearest support zone is around $0.10 to $0.102. This level is important because price is testing it during the current consolidation. A break below this area could weaken the bullish setup.
The next support areas sit near $0.085 to $0.09. A deeper move could bring DOGE toward $0.07 to $0.075. These levels may become relevant if selling pressure increases.
Resistance is also clear on the monthly and lower time frames. DOGE first needs to recover the $0.115 to $0.12 region. A move above that range would show better buyer control.
The stronger resistance zone remains between $0.14 and $0.15. A break above this area could support a wider recovery. The $0.20 to $0.25 area remains the larger upside barrier.
Read Also:
Indicators Show Caution Despite Accumulation Claims
The MACD reading on the chart remains mildly bearish. The MACD line is near 0.00013, while the signal line is around 0.00144. The histogram is near minus 0.00130.
This setup shows that momentum is still weak. Yet the negative reading is not extreme. That suggests DOGE is cooling rather than facing heavy downside momentum.
The RSI is near 44, with its moving average around 54. This places the indicator below the neutral 50 level. It also shows that buyers have not fully regained control.
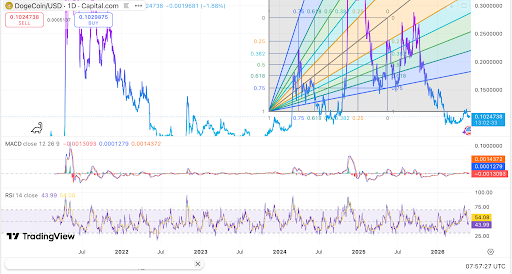 DOGE chart shows accumulation near key support, source: TradingView.
DOGE is not oversold on the displayed chart. This means the price could still fall if support fails. A move above RSI 50 would provide an early recovery signal.
The Fibonacci fan also shows pressure on the structure. Price has lost several higher support angles. DOGE would need to reclaim higher fan levels to strengthen the bullish case.
For now, the market remains focused on whether accumulation can hold. The bullish cycle argument depends on price defending $0.10 and recovering resistance.
A confirmed move above $0.15 would provide stronger technical support for the next phase.
The post Dogecoin Mirrors Past Cycles as New Accumulation Phase Fuels Bullish Momentum Up appeared first on Live Bitcoin News.


Ayrıca Şunları da Beğenebilirsiniz

Something Is Brewing In XRP’s On-Chain Data. Here’s the Latest

Justice Department has 'gone off the rails' for Trump's 'pretzel logic': analysis

SUPER Price Soars 20.52%: Social Media Buzz Ignites


Popüler Haberler
Daha fazla
