Buy Crypto
Markets
Spot
FuturesBTC
Earn
Event Center
Rewards Hub
More
What Is a Doji Candlestick? A Beginner's Guide to Identifying and Trading Doji PatternsWhat Is a Doji Candlestick? A Beginner's Guide to Identifying and Trading Doji Patterns
Category List
Cancel

What Is a Doji Candlestick? A Beginner's Guide to Identifying and Trading Doji Patterns

Key Takeaways:

  • A doji is a candlestick pattern with nearly identical opening and closing prices, often resembling a cross or plus sign.
  • A doji reflects a temporary balance between buyers and sellers and uncertainty about direction. It is not a standalone buy or sell signal.
  • Common types include the common doji, long-legged doji, dragonfly doji, gravestone doji, and four-price doji.
  • Where a doji forms, such as near support, resistance, or the end of a trend, matters more than the pattern alone.
  • MEXC's trading charts support candlestick analysis, including doji patterns, to help users assess price action.

1. What Is a Doji Candlestick?


A doji is one of the most widely followed single-candlestick patterns in technical analysis. It forms when the opening and closing prices during a trading period are identical or very close together. This produces a very small body, or no visible body at all, giving the candle a cross-like appearance.

The term "doji" comes from Japanese and refers to the relatively uncommon occurrence of matching opening and closing prices. In practice, the two prices do not need to be exactly equal. A candle can still be considered a doji if they are sufficiently close.

From a market perspective, a doji suggests that buying and selling pressure are temporarily balanced. Buyers may have pushed the price higher and sellers may have pushed it lower, but the price ultimately returns close to where it started, with neither side in control. This is why a doji is often described as a sign of indecision or a potential change in market direction.

2. What Does a Doji Candlestick Mean?


A doji has three main interpretations:

1) Market disagreement and indecision. Buying and selling pressure are balanced, with neither side able to establish direction. Momentum behind the existing trend may be weakening.

2) A potential trend change. When a doji appears after an extended rise or decline, it may suggest that the previously dominant side is losing control and that a reversal is becoming more likely.

3) A pause within an existing trend. A doji does not necessarily signal a reversal. If it forms during a brief consolidation within a strong trend and is followed by a strong candle in the same direction, it may instead support a trend-continuation interpretation.

Doji candles appear frequently on charts, and most have limited trading significance in isolation. The ones worth closer attention are those that form at key price levels.

3. Common Types of Doji Candlestick Patterns


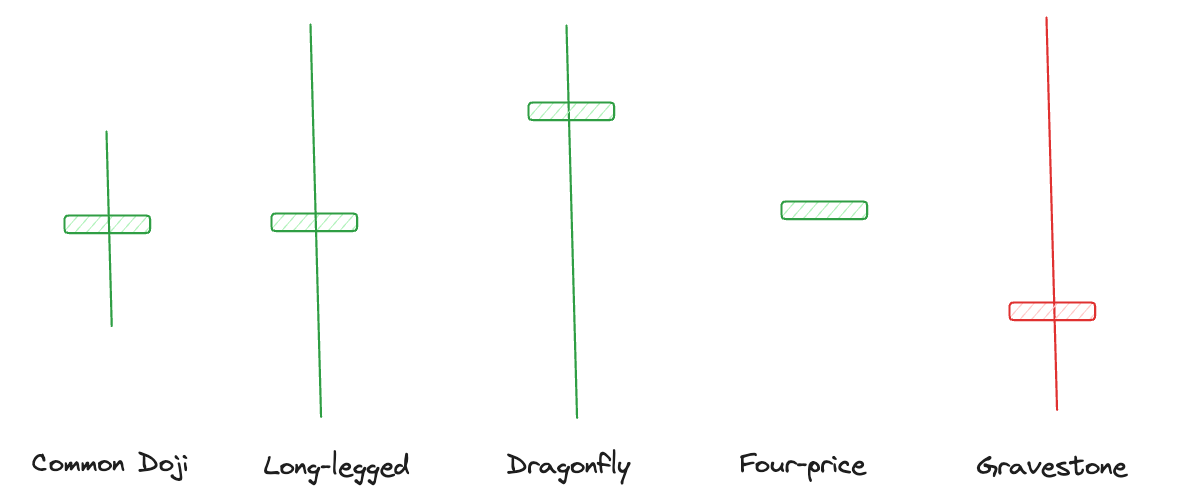
Doji patterns can be grouped into several common types based on the length and position of their upper and lower shadows, also known as wicks:

Common doji: This pattern has moderately sized upper and lower wicks, with the opening and closing prices near the middle of the candle. It typically suggests temporary indecision between buyers and sellers, regardless of the price fluctuations within the period. On its own, it offers limited evidence of a reversal.

Long-legged doji: This pattern has noticeably long upper and lower wicks, reflecting a strong tug-of-war between buyers and sellers within the same period. The price moves significantly in both directions before returning near the opening price. A long-legged doji signals pronounced disagreement and increased volatility, and may precede a change in trend.

Dragonfly doji: Resembling a "T," this pattern has nearly identical opening, high, and closing prices, with a long lower wick. Sellers push the price sharply lower before buyers bring it back toward the high, suggesting buying interest at lower levels. Near the end of a downtrend or an important support level, it is often considered a potential bullish reversal signal.

Gravestone doji: The opposite of a dragonfly doji, this pattern resembles an inverted "T" and has a long upper wick. Buyers push the price higher, but selling pressure returns and brings it back near the open, indicating resistance at higher prices. Near the end of an uptrend or an important resistance level, it is often considered a potential bearish reversal signal.

Four-price doji: The opening, high, low, and closing prices are all identical. The candle appears as a horizontal line with no wicks or body. It indicates that no price movement occurred during the period and is more commonly seen in thinly traded instruments.

4. Is a Doji Candlestick Bullish or Bearish?


A doji is a neutral pattern. It is neither inherently bullish nor bearish. Its interpretation mainly depends on three factors:

Location: At support after an extended decline, a doji may suggest that selling pressure is easing and buyers are stepping in, increasing the possibility of a bullish rebound. At resistance after an extended rise, it may indicate fading buying momentum and growing selling pressure, raising the possibility of a bearish pullback.

Trend context: A doji near the bottom of a downtrend, especially a dragonfly doji, may have bullish implications. A doji near the top of an uptrend, especially a gravestone doji, may have bearish implications. During sideways consolidation, doji candles often reflect ordinary price fluctuations.

Confirmation: The candle that follows a doji is important. A bullish candle on increased volume after a doji at a low provides stronger support for a bullish reversal. A strong bearish candle after a doji at a high adds weight to a bearish reversal interpretation.

A doji's color, whether red or green, is not a key factor. Because its opening and closing prices are nearly identical, the difference behind the color is minimal. The candle's structure and location matter more.

5. How to Trade Doji Candlestick Patterns


Beginners can use the following steps when analyzing doji patterns:

1) Identify the market environment. First, determine whether the market is trending upward, trending downward, or moving sideways. A doji near the end of a trend generally deserves closer attention.

2) Focus on key levels. Check whether the doji appears near an important support or resistance level. At these levels, it may indicate uncertainty about the market's next move.

3) Wait for confirmation. Do not enter a trade based on a doji alone. In a bullish setup, wait for a subsequent bullish candle to close above the doji's high. In a bearish setup, wait for a bearish candle to close below its low.

4) Use other tools for confirmation. Moving averages, the Relative Strength Index (RSI), Bollinger Bands, and volume can help validate a signal. For example, a doji at a high combined with an overbought reading may strengthen the case for a bearish reversal. A doji accompanied by higher volume may also carry greater significance.

5) Manage your risk. After entering a position, set a stop-loss, typically above the doji's high for a short position or below its low for a long position. Consider placing a take-profit target near the next important support or resistance level.

6. Advantages and Limitations of Doji Candlesticks


Advantages: Doji patterns are simple and easy to identify, making them accessible to beginners. They can be used across timeframes and asset classes, and may highlight changes in trend momentum to help identify potential entry and exit opportunities.

Limitations: A doji signals indecision, not a clear direction. It may precede a reversal or simply mark a pause before the existing trend resumes. Its frequent appearance can create market noise and misleading signals, and it does not provide a specific price target. Always assess its location, the prevailing trend, and subsequent confirmation candles rather than relying on the pattern alone.

7. How to Use Doji Candlesticks on MEXC


MEXC provides candlestick charting tools that let users identify doji and other patterns when trading cryptocurrencies. Users can also add technical indicators, such as moving averages and the Relative Strength Index, for a more comprehensive analysis.

MEXC's U.S. stock trading charts also support candlestick analysis, including doji patterns, allowing users to apply the same technical analysis methods across different markets. Beginners are advised to practice with small positions, gradually become familiar with how doji patterns behave in live markets, and combine this experience with risk management to develop their trading skills.

8. Doji Candlestick FAQ


8.1 Is a doji bullish or bearish?


A doji is neutral and reflects a balance between buying and selling pressure. Its bullish or bearish implications depend on its location and the candles that follow. Near support at the end of a decline, it may lean bullish. Near resistance at the end of a rise, it may lean bearish.

8.2 What does a doji candlestick mean?


A doji forms when the opening and closing prices are nearly identical, reflecting market indecision and balanced buying and selling pressure. It may suggest that the existing trend is weakening, but it is not a standalone buy or sell signal.

8.3 What happens after a doji?


The market may reverse or continue in its existing direction. Confirmation from subsequent candles is key. A strong candle against the prevailing trend, accompanied by increased volume, adds support to a reversal scenario. A strong candle in the same direction supports trend continuation.

8.4 What do three consecutive doji candles mean?


Several consecutive doji candles suggest heightened indecision and a prolonged standoff between buyers and sellers. They may precede a sharp move once the market establishes direction. Wait for a confirmed breakout before drawing conclusions.

8.5 Is there a difference between a green and a red doji?


Very little. Since the opening and closing prices are nearly identical, color is not the key consideration. The wick structure, such as a dragonfly or gravestone formation, and the pattern's location are more important.

8.6 What is the difference between a dragonfly doji and a gravestone doji?


A dragonfly doji has a long lower wick, suggesting buying interest at lower prices and a potential bullish reversal. A gravestone doji has a long upper wick, suggesting selling pressure at higher prices and a potential bearish reversal. Their directional implications are opposite.

8.7 Does a doji always signal a trend reversal?


No. A doji signals market indecision, and most have limited trading significance on their own. A potential reversal signal becomes more meaningful when the doji forms near the end of a trend, at key support or resistance, and receives confirmation from subsequent candles.

What Is a Doji Candlestick? A Beginner's Guide to Identifying and Trading Doji Patterns

Key Takeaways:

  • A doji is a candlestick pattern with nearly identical opening and closing prices, often resembling a cross or plus sign.
  • A doji reflects a temporary balance between buyers and sellers and uncertainty about direction. It is not a standalone buy or sell signal.
  • Common types include the common doji, long-legged doji, dragonfly doji, gravestone doji, and four-price doji.
  • Where a doji forms, such as near support, resistance, or the end of a trend, matters more than the pattern alone.
  • MEXC's trading charts support candlestick analysis, including doji patterns, to help users assess price action.

1. What Is a Doji Candlestick?


A doji is one of the most widely followed single-candlestick patterns in technical analysis. It forms when the opening and closing prices during a trading period are identical or very close together. This produces a very small body, or no visible body at all, giving the candle a cross-like appearance.

The term "doji" comes from Japanese and refers to the relatively uncommon occurrence of matching opening and closing prices. In practice, the two prices do not need to be exactly equal. A candle can still be considered a doji if they are sufficiently close.

From a market perspective, a doji suggests that buying and selling pressure are temporarily balanced. Buyers may have pushed the price higher and sellers may have pushed it lower, but the price ultimately returns close to where it started, with neither side in control. This is why a doji is often described as a sign of indecision or a potential change in market direction.

2. What Does a Doji Candlestick Mean?


A doji has three main interpretations:

1) Market disagreement and indecision. Buying and selling pressure are balanced, with neither side able to establish direction. Momentum behind the existing trend may be weakening.

2) A potential trend change. When a doji appears after an extended rise or decline, it may suggest that the previously dominant side is losing control and that a reversal is becoming more likely.

3) A pause within an existing trend. A doji does not necessarily signal a reversal. If it forms during a brief consolidation within a strong trend and is followed by a strong candle in the same direction, it may instead support a trend-continuation interpretation.

Doji candles appear frequently on charts, and most have limited trading significance in isolation. The ones worth closer attention are those that form at key price levels.

3. Common Types of Doji Candlestick Patterns


Doji patterns can be grouped into several common types based on the length and position of their upper and lower shadows, also known as wicks:

Common doji: This pattern has moderately sized upper and lower wicks, with the opening and closing prices near the middle of the candle. It typically suggests temporary indecision between buyers and sellers, regardless of the price fluctuations within the period. On its own, it offers limited evidence of a reversal.

Long-legged doji: This pattern has noticeably long upper and lower wicks, reflecting a strong tug-of-war between buyers and sellers within the same period. The price moves significantly in both directions before returning near the opening price. A long-legged doji signals pronounced disagreement and increased volatility, and may precede a change in trend.

Dragonfly doji: Resembling a "T," this pattern has nearly identical opening, high, and closing prices, with a long lower wick. Sellers push the price sharply lower before buyers bring it back toward the high, suggesting buying interest at lower levels. Near the end of a downtrend or an important support level, it is often considered a potential bullish reversal signal.

Gravestone doji: The opposite of a dragonfly doji, this pattern resembles an inverted "T" and has a long upper wick. Buyers push the price higher, but selling pressure returns and brings it back near the open, indicating resistance at higher prices. Near the end of an uptrend or an important resistance level, it is often considered a potential bearish reversal signal.

Four-price doji: The opening, high, low, and closing prices are all identical. The candle appears as a horizontal line with no wicks or body. It indicates that no price movement occurred during the period and is more commonly seen in thinly traded instruments.


4. Is a Doji Candlestick Bullish or Bearish?


A doji is a neutral pattern. It is neither inherently bullish nor bearish. Its interpretation mainly depends on three factors:

Location: At support after an extended decline, a doji may suggest that selling pressure is easing and buyers are stepping in, increasing the possibility of a bullish rebound. At resistance after an extended rise, it may indicate fading buying momentum and growing selling pressure, raising the possibility of a bearish pullback.

Trend context: A doji near the bottom of a downtrend, especially a dragonfly doji, may have bullish implications. A doji near the top of an uptrend, especially a gravestone doji, may have bearish implications. During sideways consolidation, doji candles often reflect ordinary price fluctuations.

Confirmation: The candle that follows a doji is important. A bullish candle on increased volume after a doji at a low provides stronger support for a bullish reversal. A strong bearish candle after a doji at a high adds weight to a bearish reversal interpretation.

A doji's color, whether red or green, is not a key factor. Because its opening and closing prices are nearly identical, the difference behind the color is minimal. The candle's structure and location matter more.

5. How to Trade Doji Candlestick Patterns


Beginners can use the following steps when analyzing doji patterns:

1) Identify the market environment. First, determine whether the market is trending upward, trending downward, or moving sideways. A doji near the end of a trend generally deserves closer attention.

2) Focus on key levels. Check whether the doji appears near an important support or resistance level. At these levels, it may indicate uncertainty about the market's next move.

3) Wait for confirmation. Do not enter a trade based on a doji alone. In a bullish setup, wait for a subsequent bullish candle to close above the doji's high. In a bearish setup, wait for a bearish candle to close below its low.

4) Use other tools for confirmation. Moving averages, the Relative Strength Index (RSI), Bollinger Bands, and volume can help validate a signal. For example, a doji at a high combined with an overbought reading may strengthen the case for a bearish reversal. A doji accompanied by higher volume may also carry greater significance.

5) Manage your risk. After entering a position, set a stop-loss, typically above the doji's high for a short position or below its low for a long position. Consider placing a take-profit target near the next important support or resistance level.

6. Advantages and Limitations of Doji Candlesticks


Advantages: Doji patterns are simple and easy to identify, making them accessible to beginners. They can be used across timeframes and asset classes, and may highlight changes in trend momentum to help identify potential entry and exit opportunities.

Limitations: A doji signals indecision, not a clear direction. It may precede a reversal or simply mark a pause before the existing trend resumes. Its frequent appearance can create market noise and misleading signals, and it does not provide a specific price target. Always assess its location, the prevailing trend, and subsequent confirmation candles rather than relying on the pattern alone.

7. How to Use Doji Candlesticks on MEXC


MEXC provides candlestick charting tools that let users identify doji and other patterns when trading cryptocurrencies. Users can also add technical indicators, such as moving averages and the Relative Strength Index, for a more comprehensive analysis.

MEXC's U.S. stock trading charts also support candlestick analysis, including doji patterns, allowing users to apply the same technical analysis methods across different markets. Beginners are advised to practice with small positions, gradually become familiar with how doji patterns behave in live markets, and combine this experience with risk management to develop their trading skills.

8. Doji Candlestick FAQ


8.1 Is a doji bullish or bearish?


A doji is neutral and reflects a balance between buying and selling pressure. Its bullish or bearish implications depend on its location and the candles that follow. Near support at the end of a decline, it may lean bullish. Near resistance at the end of a rise, it may lean bearish.

8.2 What does a doji candlestick mean?


A doji forms when the opening and closing prices are nearly identical, reflecting market indecision and balanced buying and selling pressure. It may suggest that the existing trend is weakening, but it is not a standalone buy or sell signal.

8.3 What happens after a doji?


The market may reverse or continue in its existing direction. Confirmation from subsequent candles is key. A strong candle against the prevailing trend, accompanied by increased volume, adds support to a reversal scenario. A strong candle in the same direction supports trend continuation.

8.4 What do three consecutive doji candles mean?


Several consecutive doji candles suggest heightened indecision and a prolonged standoff between buyers and sellers. They may precede a sharp move once the market establishes direction. Wait for a confirmed breakout before drawing conclusions.

8.5 Is there a difference between a green and a red doji?


Very little. Since the opening and closing prices are nearly identical, color is not the key consideration. The wick structure, such as a dragonfly or gravestone formation, and the pattern's location are more important.

8.6 What is the difference between a dragonfly doji and a gravestone doji?


A dragonfly doji has a long lower wick, suggesting buying interest at lower prices and a potential bullish reversal. A gravestone doji has a long upper wick, suggesting selling pressure at higher prices and a potential bearish reversal. Their directional implications are opposite.

8.7 Does a doji always signal a trend reversal?


No. A doji signals market indecision, and most have limited trading significance on their own. A potential reversal signal becomes more meaningful when the doji forms near the end of a trend, at key support or resistance, and receives confirmation from subsequent candles.