By Grayscale Compiled by Luffy, Foresight News Grayscale, a crypto research firm, released its Q3 2025 crypto market insights, noting that all six major cryptocurrency sectors experienced positive price returns during the quarter, but fundamentals were mixed. Bitcoin lagged behind other sectors, exhibiting characteristics of a localized altcoin season. Grayscale also highlighted three key themes: stablecoin legislation and adoption, growing trading volume on centralized exchanges, and the rise of digital asset vaults. The report also provided an outlook on potential drivers and risks for the fourth quarter. The original content is translated below: TL;DR In the third quarter of 2025, all six major cryptocurrency sectors (Crypto Sectors) had positive price returns, but fundamentals were mixed. Bitcoin has lagged behind other crypto market sectors this quarter, a pattern that could be considered an altcoin season, but with significant differences from previous cycles. The top 20 tokens in Q3 (based on volatility-adjusted price returns) highlight the importance of stablecoin legislation and adoption, rising trading volumes on centralized exchanges, and digital asset treasuries (DATs). All crypto assets are related to blockchain technology and share the same underlying market structure, but that's where the commonality ends. This asset class encompasses a wide range of software technologies, with applications spanning consumer finance, artificial intelligence (AI), media and entertainment, and other sectors. To help streamline the market, the Grayscale research team, in collaboration with FTSE Russell, developed a proprietary classification system called "Crypto Sector." This framework covers six distinct market sectors (see Figure 1), encompassing 261 tokens with a combined market capitalization of $3.5 trillion. Figure 1: Cryptocurrency sector framework Blockchain fundamentals metrics While blockchains aren't traditional businesses, we can still use analogies to measure their economic activity and financial health. The three core metrics for on-chain activity are user base, transaction volume, and transaction fees. Due to the anonymity of blockchains, analysts often use active addresses (blockchain addresses with at least one transaction) as a proxy for user numbers. In the third quarter, fundamentals across various cryptocurrency sectors were mixed (see Figure 2). On the negative side, both the "Currency Sector" and the "Smart Contract Platform Sector" saw month-over-month declines in user numbers, transaction volume, and fees. Overall, speculative activity related to meme coins has continued to cool since the first quarter, directly leading to a decline in both trading volume and activity. One positive signal worth noting is that blockchain application layer fees increased by 28% month-over-month. This growth was primarily driven by a handful of leading high-fee applications, including: (1) Jupiter, a decentralized exchange within the Solana ecosystem; (2) Aave, a leading lending protocol in the crypto space; and (3) Hyperliquid, a leading perpetual swap exchange. On an annualized basis, application layer fee revenue has now exceeded $10 billion. Blockchain is both a digital transaction network and an application development platform; therefore, the growth in application layer fees can be seen as an important signal of increasing blockchain technology adoption. Figure 2: Mixed fundamentals across cryptocurrency sectors in Q3 2025 Price Performance Tracking In the second quarter, all six major cryptocurrency sectors experienced positive price returns (see Chart 3). Bitcoin underperformed other market sectors this quarter, a pattern that could be considered an "alt season," but one that differs significantly from previous periods of declining Bitcoin dominance. The financial sector led gains, primarily benefiting from increased trading volume on centralized exchanges (CEXs). The rise in the smart contract platform sector may be related to the advancement of stablecoin legislation and its implementation. While all sectors achieved positive returns, the AI sector lagged behind other sectors, a trend consistent with the sluggish returns of AI stocks during the same period. The currency sector also underperformed, reflecting the relatively modest gains in Bitcoin prices. Chart 3: Bitcoin underperforms other crypto market sectors The diverse nature of the cryptoasset class means that dominant themes and leading sectors often shift. Figure 4 shows the top 20 tokens by volatility-adjusted price returns within the Crypto Sector Index for Q3. This list includes large-cap tokens with market capitalizations exceeding $10 billion (such as ETH, BNB, SOL, LINK, and AVAX), as well as some small- and mid-cap tokens with market capitalizations below $500 million. In terms of sector distribution, the "Financials" sector (seven assets) and the "Smart Contract Platforms" sector (five assets) dominated the top 20 list this quarter. Chart 4: Top risk-adjusted performers in the cryptocurrency sector We believe there are three key themes that stand out in the futures market: The rise of digital asset treasuries (DATs): Last quarter saw a significant increase in the number of digital asset treasuries (DATs), which are publicly listed companies that add crypto assets to their balance sheets, providing crypto exposure to equity investors. Several tokens in this quarter's top 20 (including ETH, SOL, BNB, ENA, and CRO) may have benefited from the launch of new DATs. Accelerating Stablecoin Adoption: Stablecoin legislation and implementation were another key theme last quarter. On July 18, President Trump signed the GENIUS Act, establishing a comprehensive regulatory framework for the US stablecoin market. Following its passage, stablecoin adoption accelerated significantly, with circulating supply increasing by 16% to over $290 billion (see Chart 5). The direct beneficiaries were smart contract platforms that facilitate stablecoin trading, including ETH, TRX, and AVAX, with AVAX experiencing significant growth in stablecoin trading volume. Stablecoin issuer Ethena also achieved strong price returns, despite its USDe stablecoin not being compliant with the GENIUS Act. Chart 5: Stablecoin supply increased this quarter, with the Ethereum ecosystem making a significant contribution Exchange trading volume rebounded: The third major theme was the active exchange sector. In August, centralized exchange trading volume reached a new monthly high since January (see Chart 6). This trend benefited several assets associated with centralized exchanges, including BNB, CRO, OKB, and KCS, all of which entered the top 20 list this quarter (some of which are also associated with smart contract platforms). Meanwhile, the decentralized perpetual swaps sector continues to heat up. Hyperliquid, a leading perpetual swaps exchange, saw significant expansion this quarter, ranking among the top three cryptoasset exchanges in terms of fee revenue. Smaller competitor DRIFT, surging in trading volume, successfully entered the top 20 cryptocurrency sector. Another decentralized perpetual swaps protocol, ASTER, launched in mid-September and saw its market capitalization soar from $145 million to $3.4 billion in just one week. Chart 6: Perpetual swap trading volume on centralized exchanges hit a new high in August Fourth Quarter Outlook In Q4, the drivers of cryptocurrency sector returns are likely to differ from those in Q3. Key potential catalysts include: First, the relevant U.S. Senate committee has begun advancing legislation on cryptocurrency market structure, following the bipartisan passage of the relevant bill in the House of Representatives in July. This bill will provide a comprehensive financial services regulatory framework for the crypto industry, potentially promoting the deep integration of the crypto market with traditional financial services. Secondly, the U.S. Securities and Exchange Commission (SEC) has approved universal listing standards for commodity exchange-traded products (ETPs). This move could make more crypto assets available to U.S. investors through ETP structures, further expanding market access. Finally, the macroeconomic environment is likely to continue evolving. Last week, the Federal Reserve announced a 25 basis point interest rate cut and hinted at two more rate cuts this year. Crypto assets are expected to benefit from this rate cut, as it reduces the opportunity cost of holding non-interest-bearing assets and may increase investor risk appetite. Meanwhile, a weak US labor market, high stock market valuations, and geopolitical uncertainty will be key downside risks for the crypto market in the fourth quarter.By Grayscale Compiled by Luffy, Foresight News Grayscale, a crypto research firm, released its Q3 2025 crypto market insights, noting that all six major cryptocurrency sectors experienced positive price returns during the quarter, but fundamentals were mixed. Bitcoin lagged behind other sectors, exhibiting characteristics of a localized altcoin season. Grayscale also highlighted three key themes: stablecoin legislation and adoption, growing trading volume on centralized exchanges, and the rise of digital asset vaults. The report also provided an outlook on potential drivers and risks for the fourth quarter. The original content is translated below: TL;DR In the third quarter of 2025, all six major cryptocurrency sectors (Crypto Sectors) had positive price returns, but fundamentals were mixed. Bitcoin has lagged behind other crypto market sectors this quarter, a pattern that could be considered an altcoin season, but with significant differences from previous cycles. The top 20 tokens in Q3 (based on volatility-adjusted price returns) highlight the importance of stablecoin legislation and adoption, rising trading volumes on centralized exchanges, and digital asset treasuries (DATs). All crypto assets are related to blockchain technology and share the same underlying market structure, but that's where the commonality ends. This asset class encompasses a wide range of software technologies, with applications spanning consumer finance, artificial intelligence (AI), media and entertainment, and other sectors. To help streamline the market, the Grayscale research team, in collaboration with FTSE Russell, developed a proprietary classification system called "Crypto Sector." This framework covers six distinct market sectors (see Figure 1), encompassing 261 tokens with a combined market capitalization of $3.5 trillion. Figure 1: Cryptocurrency sector framework Blockchain fundamentals metrics While blockchains aren't traditional businesses, we can still use analogies to measure their economic activity and financial health. The three core metrics for on-chain activity are user base, transaction volume, and transaction fees. Due to the anonymity of blockchains, analysts often use active addresses (blockchain addresses with at least one transaction) as a proxy for user numbers. In the third quarter, fundamentals across various cryptocurrency sectors were mixed (see Figure 2). On the negative side, both the "Currency Sector" and the "Smart Contract Platform Sector" saw month-over-month declines in user numbers, transaction volume, and fees. Overall, speculative activity related to meme coins has continued to cool since the first quarter, directly leading to a decline in both trading volume and activity. One positive signal worth noting is that blockchain application layer fees increased by 28% month-over-month. This growth was primarily driven by a handful of leading high-fee applications, including: (1) Jupiter, a decentralized exchange within the Solana ecosystem; (2) Aave, a leading lending protocol in the crypto space; and (3) Hyperliquid, a leading perpetual swap exchange. On an annualized basis, application layer fee revenue has now exceeded $10 billion. Blockchain is both a digital transaction network and an application development platform; therefore, the growth in application layer fees can be seen as an important signal of increasing blockchain technology adoption. Figure 2: Mixed fundamentals across cryptocurrency sectors in Q3 2025 Price Performance Tracking In the second quarter, all six major cryptocurrency sectors experienced positive price returns (see Chart 3). Bitcoin underperformed other market sectors this quarter, a pattern that could be considered an "alt season," but one that differs significantly from previous periods of declining Bitcoin dominance. The financial sector led gains, primarily benefiting from increased trading volume on centralized exchanges (CEXs). The rise in the smart contract platform sector may be related to the advancement of stablecoin legislation and its implementation. While all sectors achieved positive returns, the AI sector lagged behind other sectors, a trend consistent with the sluggish returns of AI stocks during the same period. The currency sector also underperformed, reflecting the relatively modest gains in Bitcoin prices. Chart 3: Bitcoin underperforms other crypto market sectors The diverse nature of the cryptoasset class means that dominant themes and leading sectors often shift. Figure 4 shows the top 20 tokens by volatility-adjusted price returns within the Crypto Sector Index for Q3. This list includes large-cap tokens with market capitalizations exceeding $10 billion (such as ETH, BNB, SOL, LINK, and AVAX), as well as some small- and mid-cap tokens with market capitalizations below $500 million. In terms of sector distribution, the "Financials" sector (seven assets) and the "Smart Contract Platforms" sector (five assets) dominated the top 20 list this quarter. Chart 4: Top risk-adjusted performers in the cryptocurrency sector We believe there are three key themes that stand out in the futures market: The rise of digital asset treasuries (DATs): Last quarter saw a significant increase in the number of digital asset treasuries (DATs), which are publicly listed companies that add crypto assets to their balance sheets, providing crypto exposure to equity investors. Several tokens in this quarter's top 20 (including ETH, SOL, BNB, ENA, and CRO) may have benefited from the launch of new DATs. Accelerating Stablecoin Adoption: Stablecoin legislation and implementation were another key theme last quarter. On July 18, President Trump signed the GENIUS Act, establishing a comprehensive regulatory framework for the US stablecoin market. Following its passage, stablecoin adoption accelerated significantly, with circulating supply increasing by 16% to over $290 billion (see Chart 5). The direct beneficiaries were smart contract platforms that facilitate stablecoin trading, including ETH, TRX, and AVAX, with AVAX experiencing significant growth in stablecoin trading volume. Stablecoin issuer Ethena also achieved strong price returns, despite its USDe stablecoin not being compliant with the GENIUS Act. Chart 5: Stablecoin supply increased this quarter, with the Ethereum ecosystem making a significant contribution Exchange trading volume rebounded: The third major theme was the active exchange sector. In August, centralized exchange trading volume reached a new monthly high since January (see Chart 6). This trend benefited several assets associated with centralized exchanges, including BNB, CRO, OKB, and KCS, all of which entered the top 20 list this quarter (some of which are also associated with smart contract platforms). Meanwhile, the decentralized perpetual swaps sector continues to heat up. Hyperliquid, a leading perpetual swaps exchange, saw significant expansion this quarter, ranking among the top three cryptoasset exchanges in terms of fee revenue. Smaller competitor DRIFT, surging in trading volume, successfully entered the top 20 cryptocurrency sector. Another decentralized perpetual swaps protocol, ASTER, launched in mid-September and saw its market capitalization soar from $145 million to $3.4 billion in just one week. Chart 6: Perpetual swap trading volume on centralized exchanges hit a new high in August Fourth Quarter Outlook In Q4, the drivers of cryptocurrency sector returns are likely to differ from those in Q3. Key potential catalysts include: First, the relevant U.S. Senate committee has begun advancing legislation on cryptocurrency market structure, following the bipartisan passage of the relevant bill in the House of Representatives in July. This bill will provide a comprehensive financial services regulatory framework for the crypto industry, potentially promoting the deep integration of the crypto market with traditional financial services. Secondly, the U.S. Securities and Exchange Commission (SEC) has approved universal listing standards for commodity exchange-traded products (ETPs). This move could make more crypto assets available to U.S. investors through ETP structures, further expanding market access. Finally, the macroeconomic environment is likely to continue evolving. Last week, the Federal Reserve announced a 25 basis point interest rate cut and hinted at two more rate cuts this year. Crypto assets are expected to benefit from this rate cut, as it reduces the opportunity cost of holding non-interest-bearing assets and may increase investor risk appetite. Meanwhile, a weak US labor market, high stock market valuations, and geopolitical uncertainty will be key downside risks for the crypto market in the fourth quarter.

Grayscale: Q3 saw another localized copycat season, how will Q4 develop?

2025/09/27 10:30

By Grayscale

Compiled by Luffy, Foresight News

Grayscale, a crypto research firm, released its Q3 2025 crypto market insights, noting that all six major cryptocurrency sectors experienced positive price returns during the quarter, but fundamentals were mixed. Bitcoin lagged behind other sectors, exhibiting characteristics of a localized altcoin season. Grayscale also highlighted three key themes: stablecoin legislation and adoption, growing trading volume on centralized exchanges, and the rise of digital asset vaults. The report also provided an outlook on potential drivers and risks for the fourth quarter. The original content is translated below:

TL;DR

  • In the third quarter of 2025, all six major cryptocurrency sectors (Crypto Sectors) had positive price returns, but fundamentals were mixed.
  • Bitcoin has lagged behind other crypto market sectors this quarter, a pattern that could be considered an altcoin season, but with significant differences from previous cycles.
  • The top 20 tokens in Q3 (based on volatility-adjusted price returns) highlight the importance of stablecoin legislation and adoption, rising trading volumes on centralized exchanges, and digital asset treasuries (DATs).

All crypto assets are related to blockchain technology and share the same underlying market structure, but that's where the commonality ends. This asset class encompasses a wide range of software technologies, with applications spanning consumer finance, artificial intelligence (AI), media and entertainment, and other sectors. To help streamline the market, the Grayscale research team, in collaboration with FTSE Russell, developed a proprietary classification system called "Crypto Sector." This framework covers six distinct market sectors (see Figure 1), encompassing 261 tokens with a combined market capitalization of $3.5 trillion.
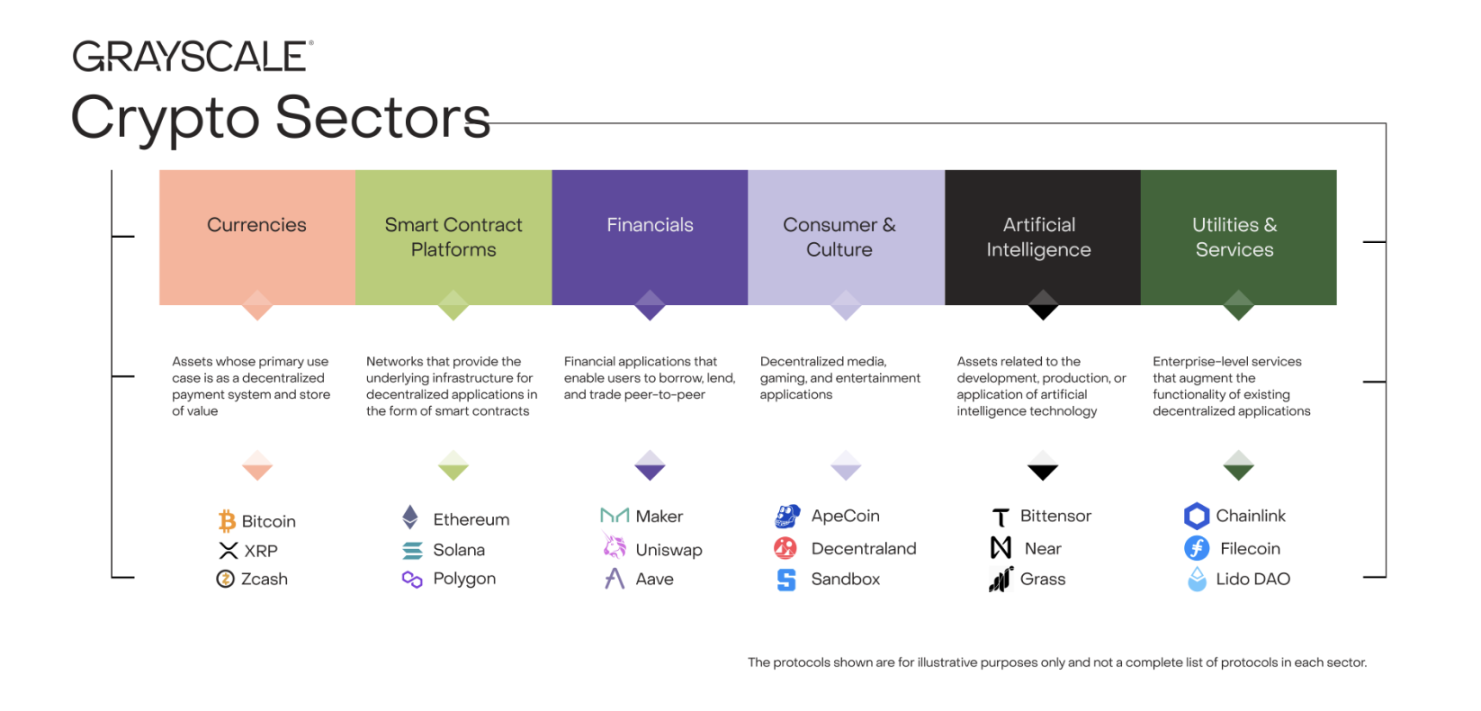
 Figure 1: Cryptocurrency sector framework

Blockchain fundamentals metrics

While blockchains aren't traditional businesses, we can still use analogies to measure their economic activity and financial health. The three core metrics for on-chain activity are user base, transaction volume, and transaction fees. Due to the anonymity of blockchains, analysts often use active addresses (blockchain addresses with at least one transaction) as a proxy for user numbers.

In the third quarter, fundamentals across various cryptocurrency sectors were mixed (see Figure 2). On the negative side, both the "Currency Sector" and the "Smart Contract Platform Sector" saw month-over-month declines in user numbers, transaction volume, and fees. Overall, speculative activity related to meme coins has continued to cool since the first quarter, directly leading to a decline in both trading volume and activity.

One positive signal worth noting is that blockchain application layer fees increased by 28% month-over-month. This growth was primarily driven by a handful of leading high-fee applications, including: (1) Jupiter, a decentralized exchange within the Solana ecosystem; (2) Aave, a leading lending protocol in the crypto space; and (3) Hyperliquid, a leading perpetual swap exchange. On an annualized basis, application layer fee revenue has now exceeded $10 billion. Blockchain is both a digital transaction network and an application development platform; therefore, the growth in application layer fees can be seen as an important signal of increasing blockchain technology adoption.
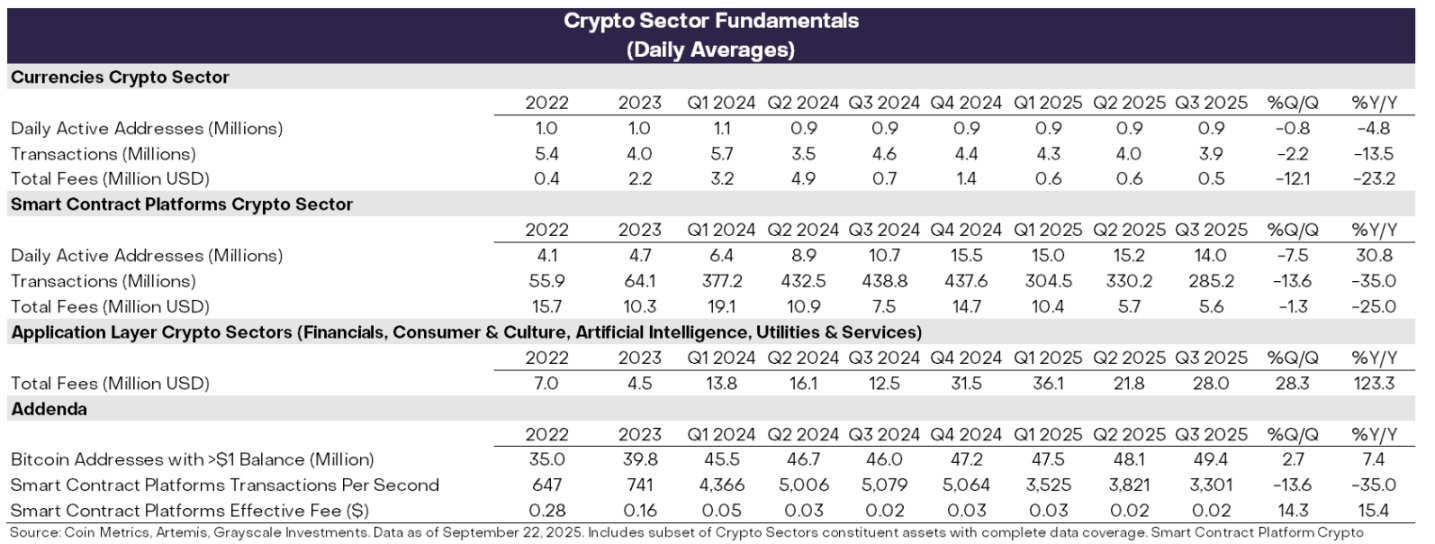
 Figure 2: Mixed fundamentals across cryptocurrency sectors in Q3 2025

Price Performance Tracking

In the second quarter, all six major cryptocurrency sectors experienced positive price returns (see Chart 3). Bitcoin underperformed other market sectors this quarter, a pattern that could be considered an "alt season," but one that differs significantly from previous periods of declining Bitcoin dominance.

The financial sector led gains, primarily benefiting from increased trading volume on centralized exchanges (CEXs). The rise in the smart contract platform sector may be related to the advancement of stablecoin legislation and its implementation. While all sectors achieved positive returns, the AI sector lagged behind other sectors, a trend consistent with the sluggish returns of AI stocks during the same period. The currency sector also underperformed, reflecting the relatively modest gains in Bitcoin prices.
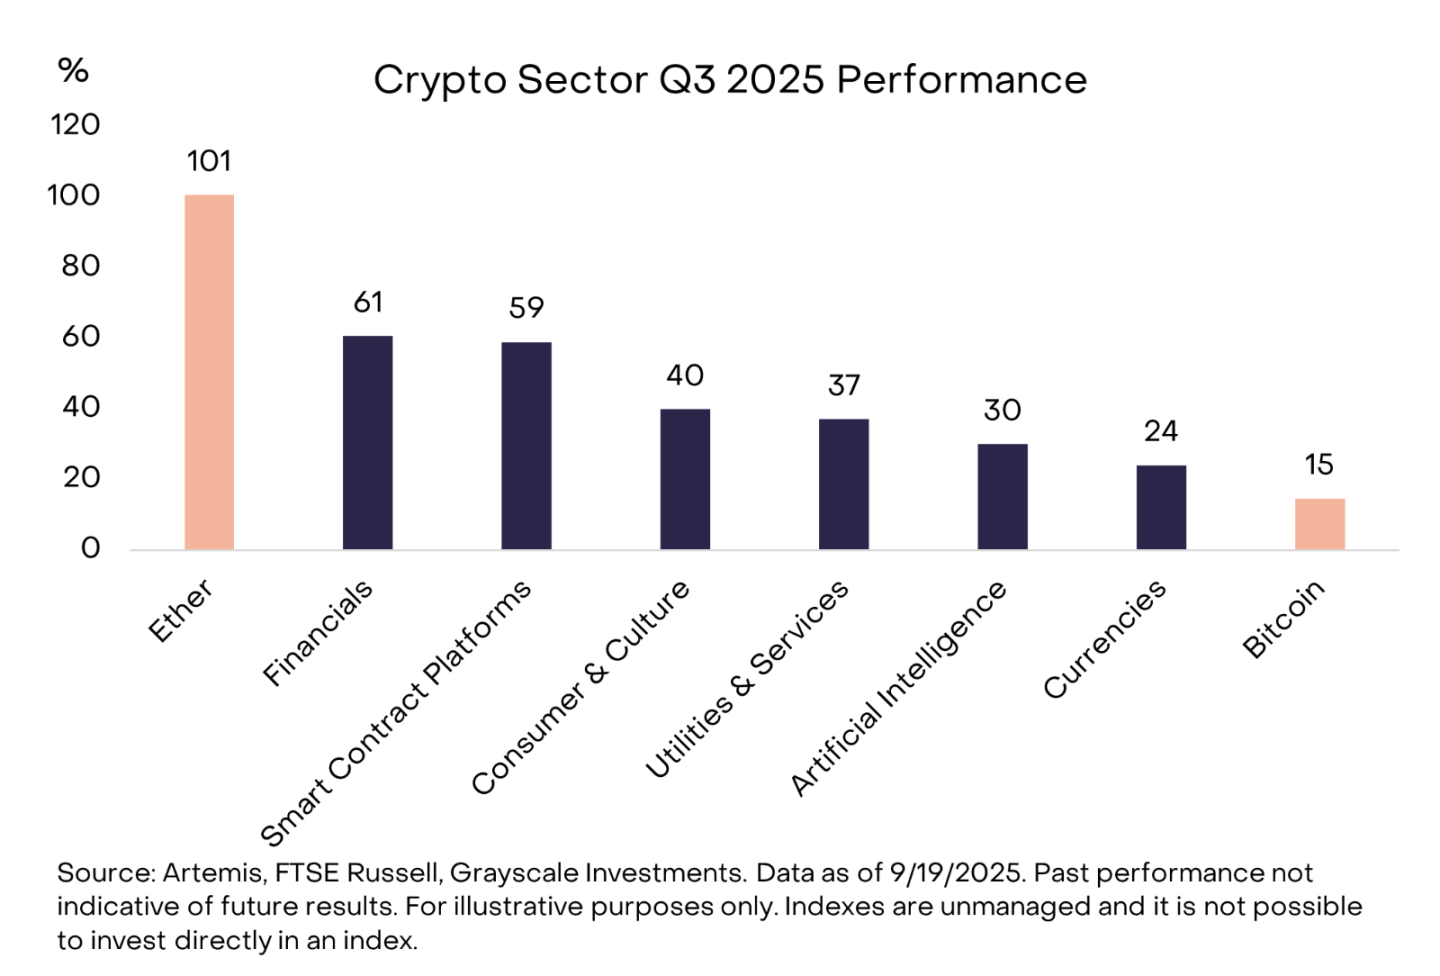
 Chart 3: Bitcoin underperforms other crypto market sectors

The diverse nature of the cryptoasset class means that dominant themes and leading sectors often shift. Figure 4 shows the top 20 tokens by volatility-adjusted price returns within the Crypto Sector Index for Q3. This list includes large-cap tokens with market capitalizations exceeding $10 billion (such as ETH, BNB, SOL, LINK, and AVAX), as well as some small- and mid-cap tokens with market capitalizations below $500 million. In terms of sector distribution, the "Financials" sector (seven assets) and the "Smart Contract Platforms" sector (five assets) dominated the top 20 list this quarter.
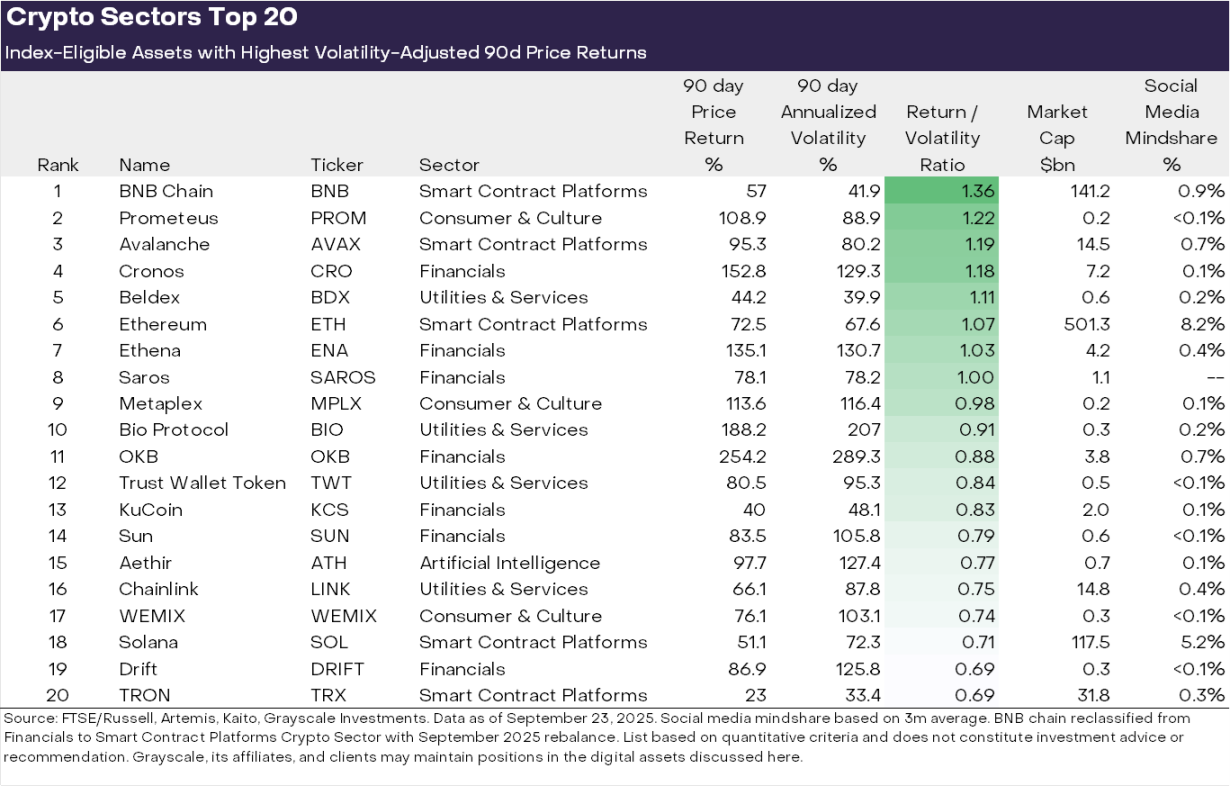
 Chart 4: Top risk-adjusted performers in the cryptocurrency sector

We believe there are three key themes that stand out in the futures market:

The rise of digital asset treasuries (DATs): Last quarter saw a significant increase in the number of digital asset treasuries (DATs), which are publicly listed companies that add crypto assets to their balance sheets, providing crypto exposure to equity investors. Several tokens in this quarter's top 20 (including ETH, SOL, BNB, ENA, and CRO) may have benefited from the launch of new DATs.

Accelerating Stablecoin Adoption: Stablecoin legislation and implementation were another key theme last quarter. On July 18, President Trump signed the GENIUS Act, establishing a comprehensive regulatory framework for the US stablecoin market. Following its passage, stablecoin adoption accelerated significantly, with circulating supply increasing by 16% to over $290 billion (see Chart 5). The direct beneficiaries were smart contract platforms that facilitate stablecoin trading, including ETH, TRX, and AVAX, with AVAX experiencing significant growth in stablecoin trading volume. Stablecoin issuer Ethena also achieved strong price returns, despite its USDe stablecoin not being compliant with the GENIUS Act.
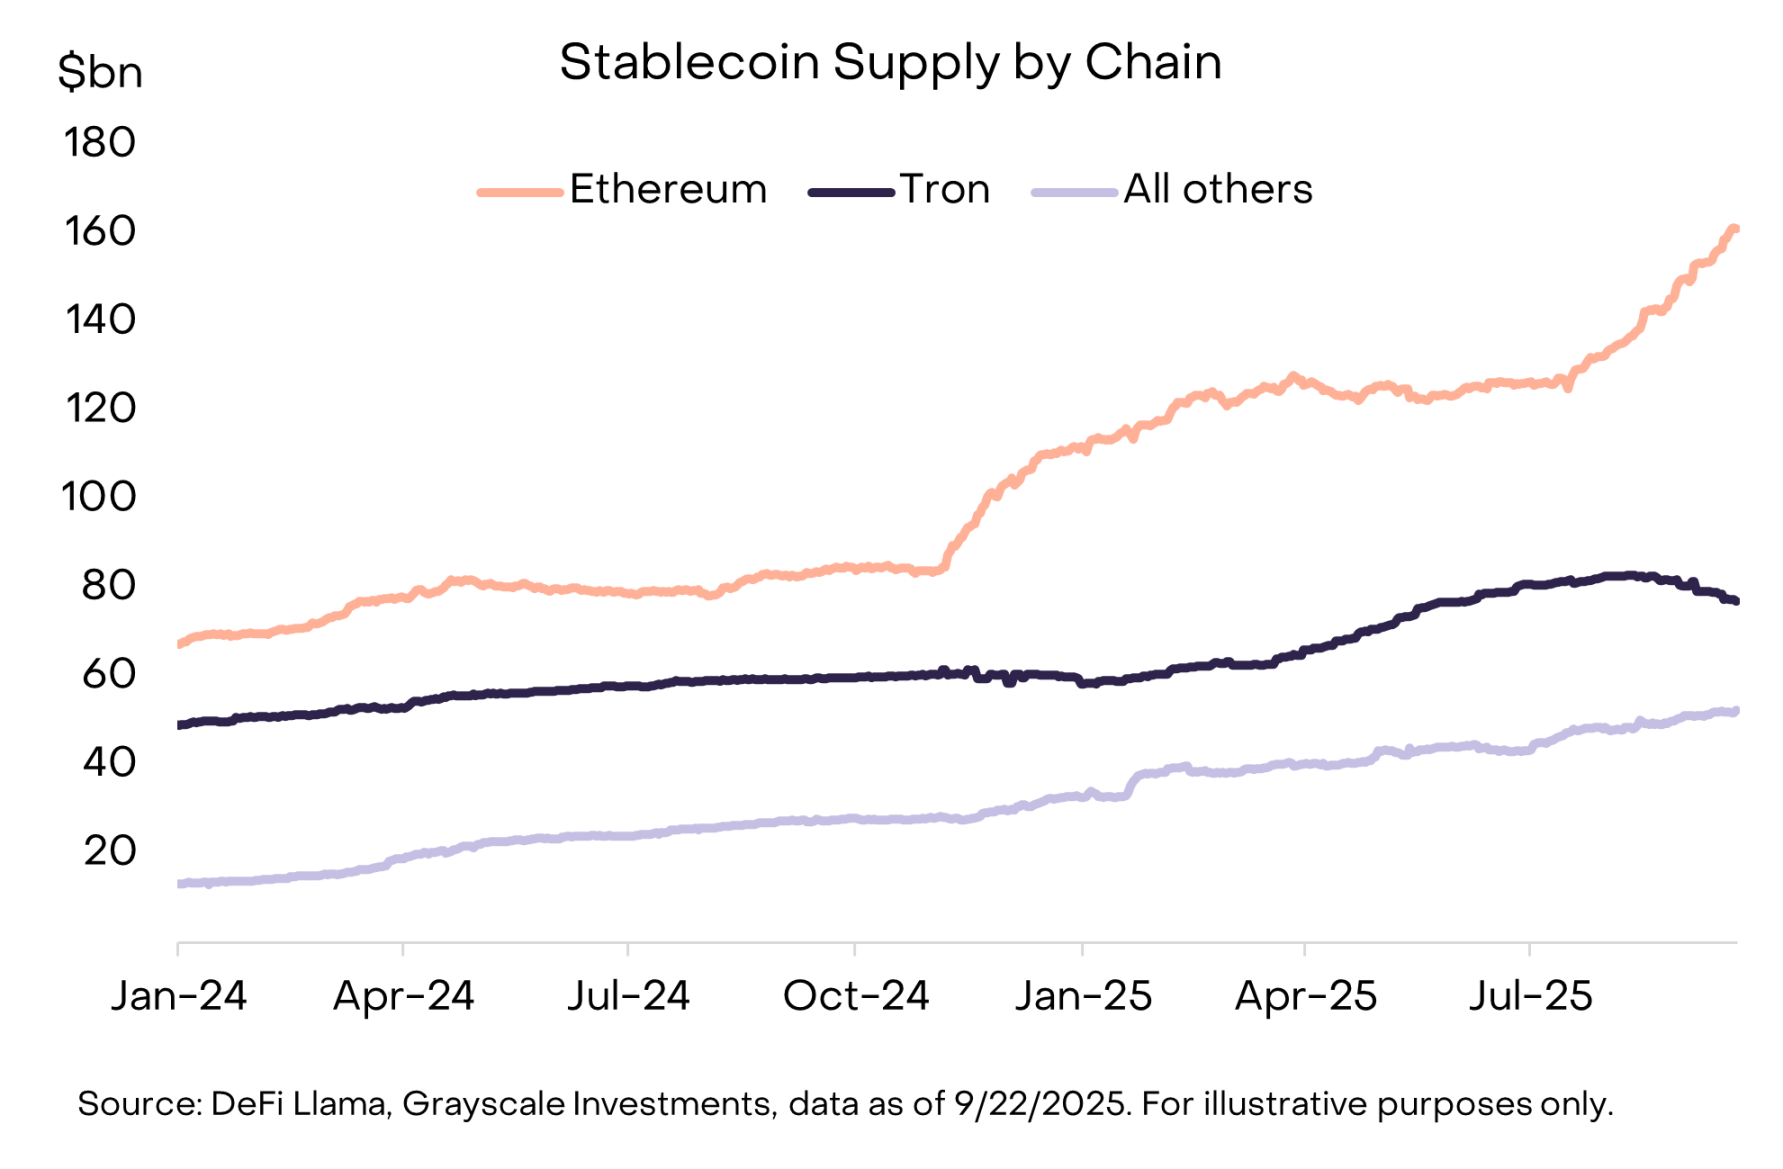
 Chart 5: Stablecoin supply increased this quarter, with the Ethereum ecosystem making a significant contribution

Exchange trading volume rebounded: The third major theme was the active exchange sector. In August, centralized exchange trading volume reached a new monthly high since January (see Chart 6). This trend benefited several assets associated with centralized exchanges, including BNB, CRO, OKB, and KCS, all of which entered the top 20 list this quarter (some of which are also associated with smart contract platforms).

Meanwhile, the decentralized perpetual swaps sector continues to heat up. Hyperliquid, a leading perpetual swaps exchange, saw significant expansion this quarter, ranking among the top three cryptoasset exchanges in terms of fee revenue. Smaller competitor DRIFT, surging in trading volume, successfully entered the top 20 cryptocurrency sector. Another decentralized perpetual swaps protocol, ASTER, launched in mid-September and saw its market capitalization soar from $145 million to $3.4 billion in just one week.
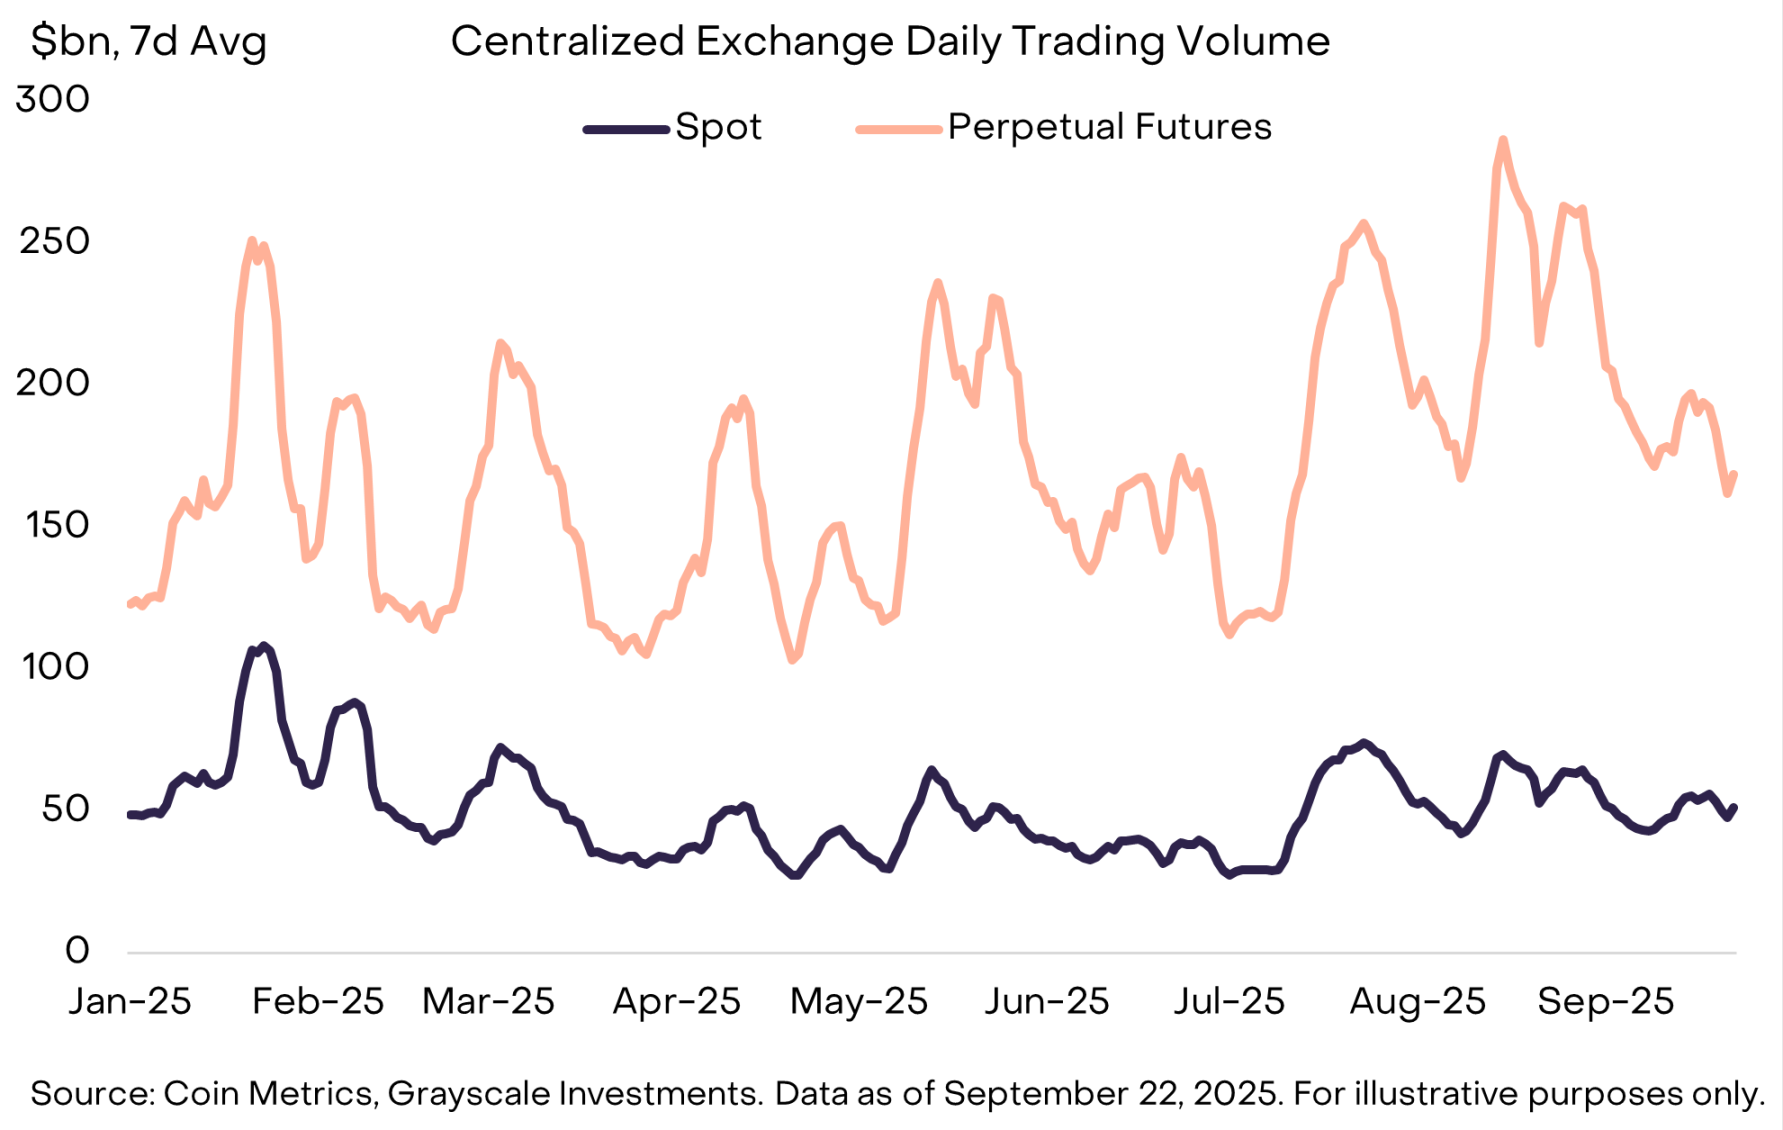
 Chart 6: Perpetual swap trading volume on centralized exchanges hit a new high in August

Fourth Quarter Outlook

In Q4, the drivers of cryptocurrency sector returns are likely to differ from those in Q3. Key potential catalysts include:

First, the relevant U.S. Senate committee has begun advancing legislation on cryptocurrency market structure, following the bipartisan passage of the relevant bill in the House of Representatives in July. This bill will provide a comprehensive financial services regulatory framework for the crypto industry, potentially promoting the deep integration of the crypto market with traditional financial services.

Secondly, the U.S. Securities and Exchange Commission (SEC) has approved universal listing standards for commodity exchange-traded products (ETPs). This move could make more crypto assets available to U.S. investors through ETP structures, further expanding market access.

Finally, the macroeconomic environment is likely to continue evolving. Last week, the Federal Reserve announced a 25 basis point interest rate cut and hinted at two more rate cuts this year. Crypto assets are expected to benefit from this rate cut, as it reduces the opportunity cost of holding non-interest-bearing assets and may increase investor risk appetite. Meanwhile, a weak US labor market, high stock market valuations, and geopolitical uncertainty will be key downside risks for the crypto market in the fourth quarter.

Disclaimer: The articles reposted on this site are sourced from public platforms and are provided for informational purposes only. They do not necessarily reflect the views of MEXC. All rights remain with the original authors. If you believe any content infringes on third-party rights, please contact service@support.mexc.com for removal. MEXC makes no guarantees regarding the accuracy, completeness, or timeliness of the content and is not responsible for any actions taken based on the information provided. The content does not constitute financial, legal, or other professional advice, nor should it be considered a recommendation or endorsement by MEXC.
Share Insights

You May Also Like

US Spot ETH ETFs Witness Remarkable $244M Inflow Surge

US Spot ETH ETFs Witness Remarkable $244M Inflow Surge

BitcoinWorld US Spot ETH ETFs Witness Remarkable $244M Inflow Surge The world of digital assets is buzzing with exciting news! US spot ETH ETFs recently experienced a significant milestone, recording a whopping $244 million in net inflows on October 28. This marks the second consecutive day of positive movement for these crucial investment vehicles, signaling a growing appetite for Ethereum exposure among mainstream investors. What’s Fueling the Latest US Spot ETH ETFs Inflow? This impressive influx of capital into US spot ETH ETFs highlights a clear trend: institutional and retail investors are increasingly comfortable with regulated crypto investment products. The figures, reported by industry tracker Trader T, show a robust interest that could reshape the market. Fidelity’s FETH led the charge, attracting a substantial $99.27 million. This demonstrates strong confidence in Fidelity’s offering and Ethereum’s long-term potential. BlackRock’s ETHA wasn’t far behind, securing $74.74 million in inflows. BlackRock’s entry into the crypto ETF space has been closely watched, and these numbers confirm its growing influence. Grayscale’s Mini ETH also saw significant action, pulling in $73.03 million. This new product is quickly gaining traction, offering investors another avenue for Ethereum exposure. It’s important to note that while most products saw positive flows, Grayscale’s ETHE experienced a net outflow of $2.66 million. This might suggest a shift in investor preference towards newer, perhaps more cost-effective, spot ETF options. Why Are US Spot ETH ETFs Attracting Such Significant Capital? The appeal of US spot ETH ETFs is multifaceted. For many investors, these products offer a regulated and accessible way to gain exposure to Ethereum without directly owning the cryptocurrency. This removes some of the complexities associated with digital asset management, such as setting up wallets, managing private keys, or dealing with less regulated exchanges. Key benefits include: Accessibility: Investors can buy and sell shares of the ETF through traditional brokerage accounts, just like stocks. Regulation: Being regulated by financial authorities provides a layer of security and trust that some investors seek. Diversification: For traditional portfolios, adding exposure to a leading altcoin like Ethereum through an ETF can offer diversification benefits. Liquidity: ETFs are generally liquid, allowing for easy entry and exit from positions. Moreover, Ethereum itself continues to be a powerhouse in the blockchain space, underpinning a vast ecosystem of decentralized applications (dApps), NFTs, and decentralized finance (DeFi) protocols. Its ongoing development and significant network activity make it an attractive asset for long-term growth. What Does This US Spot ETH ETFs Trend Mean for Investors? The consistent positive inflows into US spot ETH ETFs could be a strong indicator of maturing institutional interest in the broader crypto market. It suggests that major financial players are not just dabbling but are actively integrating digital assets into their investment strategies. For individual investors, this trend offers several actionable insights: Market Validation: The increasing capital flow validates Ethereum’s position as a significant digital asset with real-world utility and investor demand. Potential for Growth: Continued institutional adoption through ETFs could contribute to greater price stability and potential upward momentum for Ethereum. Observing Investor Behavior: The shift from products like Grayscale’s ETHE to newer spot ETFs highlights how investors are becoming more discerning about their investment vehicles, prioritizing efficiency and cost. However, it is crucial to remember that the crypto market remains volatile. While these inflows are positive, investors should always conduct their own research and consider their risk tolerance before making investment decisions. A Compelling Outlook for US Spot ETH ETFs The recent $244 million net inflow into US spot ETH ETFs is more than just a number; it’s a powerful signal. It underscores a growing confidence in Ethereum as an asset class and the increasing mainstream acceptance of regulated cryptocurrency investment products. With major players like Fidelity and BlackRock leading the charge, the landscape for digital asset investment is evolving rapidly, offering exciting new opportunities for both seasoned and new investors alike. This positive momentum suggests a potentially bright future for Ethereum’s integration into traditional financial portfolios. Frequently Asked Questions (FAQs) What is a US spot ETH ETF? A US spot ETH ETF (Exchange-Traded Fund) is an investment product that allows investors to gain exposure to the price movements of Ethereum (ETH) without directly owning the cryptocurrency. The fund holds actual Ethereum, and shares of the fund are traded on traditional stock exchanges. Which firms are leading the inflows into US spot ETH ETFs? On October 28, Fidelity’s FETH led with $99.27 million, followed by BlackRock’s ETHA with $74.74 million, and Grayscale’s Mini ETH with $73.03 million. Why are spot ETH ETFs important for the crypto market? Spot ETH ETFs are crucial because they provide a regulated, accessible, and often more familiar investment vehicle for traditional investors to enter the cryptocurrency market. This can lead to increased institutional adoption, greater liquidity, and enhanced legitimacy for Ethereum as an asset class. What was Grayscale’s ETHE outflow and what does it signify? Grayscale’s ETHE experienced a net outflow of $2.66 million. This might indicate that some investors are shifting capital from older, perhaps less efficient, Grayscale products to newer spot ETH ETFs, which often offer better fee structures or direct exposure without the previous trust structure limitations. If you found this article insightful, consider sharing it with your network! Your support helps us bring more valuable insights into the world of cryptocurrency. Spread the word and let others discover the exciting trends shaping the digital asset space. To learn more about the latest Ethereum trends, explore our article on key developments shaping Ethereum institutional adoption. This post US Spot ETH ETFs Witness Remarkable $244M Inflow Surge first appeared on BitcoinWorld.
Share
2025/10/29 11:45
First Ethereum Treasury Firm Sells ETH For Buybacks: Death Spiral Incoming?

First Ethereum Treasury Firm Sells ETH For Buybacks: Death Spiral Incoming?

Ethereum-focused treasury company ETHZilla said it has sold roughly $40 million worth of ether to fund ongoing share repurchases, a maneuver aimed at closing what it calls a “significant discount to NAV.” In a press statement on Monday, the company disclosed that since Friday, October 24, it has bought back about 600,000 common shares for approximately $12 million under a broader authorization of up to $250 million, and that it intends to continue buying while the discount persists. ETHZilla Dumps ETH For BuyBacks The company framed the buybacks as balance-sheet arbitrage rather than a strategic retreat from its core Ethereum exposure. “We are leveraging the strength of our balance sheet, including reducing our ETH holdings, to execute share repurchases,” chairman and CEO McAndrew Rudisill said, adding that ETH sales are being used as “cash” while common shares trade below net asset value. He argued the transactions would be immediately accretive to remaining shareholders. Related Reading: Crypto Analyst Shows The Possibility Of The Ethereum Price Reaching $16,000 ETHZilla amplified the message on X, saying it would “use its strong balance sheet to support shareholders through buybacks, reduce shares available for short borrow, [and] drive up NAV per share” and reiterating that it still holds “~$400 million of ETH” on the balance sheet and carries “no net debt.” The company also cited “recent, concentrated short selling” as a factor keeping the stock under pressure. The market-structure logic is straightforward: when a digital-asset treasury trades below the value of its coin holdings and cash, buying back stock with “coin-cash” can, in theory, collapse the discount and lift NAV per share. But the optics are contentious inside crypto because the mechanism requires selling the underlying asset—here, ETH—to purchase equity, potentially weakening the very treasury backing that investors originally sought. Death Spiral Incoming? Popular crypto trader SalsaTekila (@SalsaTekila) commented on X: “This is extremely bearish, especially if it invites similar behavior. ETH treasuries are not Saylor; they haven’t shown diamond-hand will. If treasury companies start dumping the coin to buy shares, it’s a death spiral setup.” Skeptics also zeroed in on funding choices. “I am mostly curious why the company chose to sell ETH and not use the $569m in cash they had on the balance sheet last month,” another analyst Dan Smith wrote, noting ETHZilla had just said it still holds about $400 million of ETH and thus didn’t deploy it on fresh ETH accumulation. “Why not just use cash?” The question cuts to the core of treasury signaling: using ETH as a liquidity reservoir to defend a discounted equity can be read as rational capital allocation, or as capitulation that undermines the ETH-as-reserve narrative. Beyond the buyback, a retail-driven storyline has rapidly formed around the stock. Business Insider reported that Dimitri Semenikhin—who recently became the face of the Beyond Meat surge—has targeted ETHZilla, saying he purchased roughly 2% of the company at what he views as a 50% discount to modified NAV. He has argued that the market is misreading ETHZilla’s balance sheet because it still reflects legacy biotech results rather than the current digital-asset treasury model. Related Reading: Ethereum Emerges As The Sole Trillion-Dollar Institutional Store Of Value — Here’s Why The same report cites liquid holdings on the order of 102,300 ETH and roughly $560 million in cash, translating to about $62 per share in liquid assets, and calls out a 1-for-10 reverse split on October 15 that, in his view, muddied the optics for retail. Semenikhin flagged November 13 as a potential catalyst if results show the pivot to ETH generating profits. The company’s own messaging emphasizes the discount-to-NAV lens rather than a change in strategy. ETHZilla told investors it would keep buying while the stock trades below asset value and highlighted a goal of shrinking lendable supply to blunt short-selling pressure. For Ethereum markets, the immediate flow effect is limited—$40 million is marginal in ETH’s daily liquidity—but the second-order risk flagged by traders is behavioral contagion. If other ETH-heavy treasuries follow the playbook, selling the underlying to buy their own stock, the flow could become pro-cyclical: coins are sold to close equity discounts, the selling pressures spot, and wider discounts reappear as equity screens rerate to the weaker mark—repeat. That is the “death spiral” scenario skeptics warn about when the treasury asset doubles as the company’s signal of conviction. At press time, ETH traded at $4,156. Featured image created with DALL.E, chart from TradingView.com
Share
2025/10/29 12:00