Amazon Stock Today: Short-Term Weakness Within a Broader AMZN Consolidation

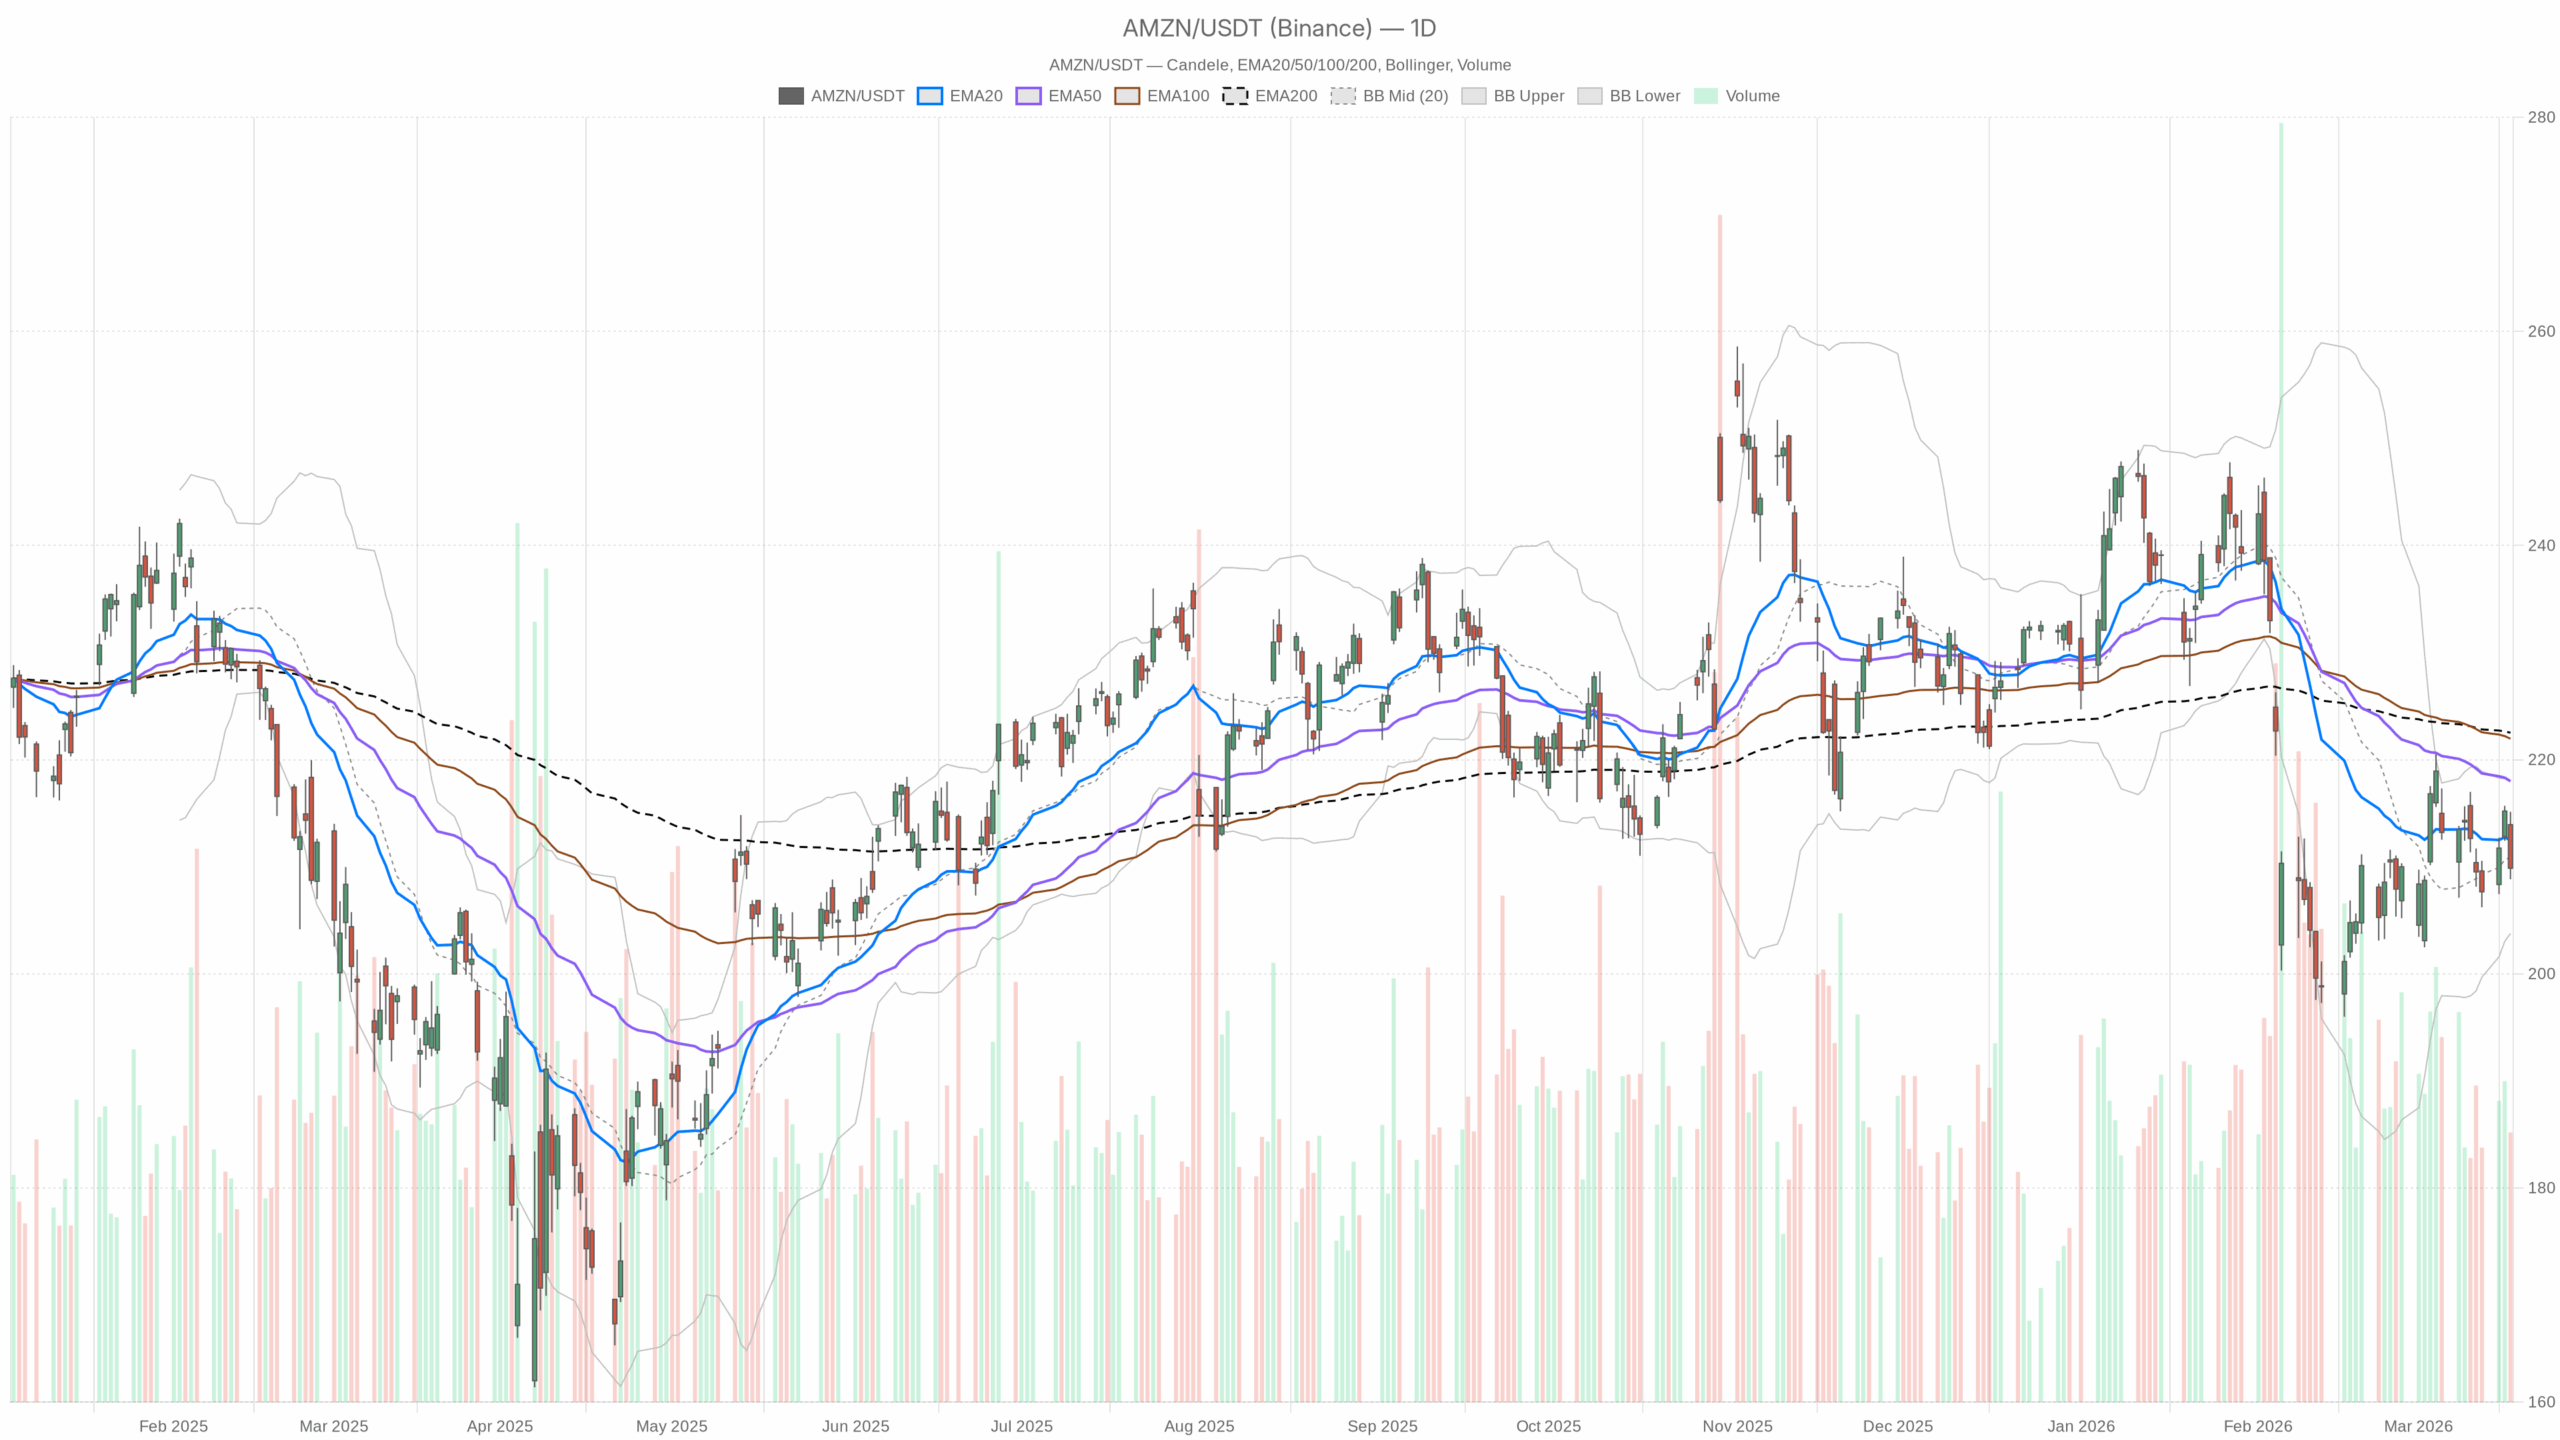 AMZN — daily chart with candlesticks, EMA20/EMA50 and volume.
Amazon Stock Today: Short-Term Weakness Inside a Broader Consolidation
Amazon stock today is trading in a soft, corrective phase rather than a clear breakdown. The daily chart leans mildly bearish, but price is still oscillating within a broader consolidation band instead of trending vertically lower. In practice, that leaves AMZN in a pullback phase where downside risk is present, yet the medium-term growth story and recent bullish research coverage keep a constructive backdrop in place.
On the daily timeframe, Wednesday’s close at $209.87 extended the retreat from the early-month highs and kept price below the key short-term averages. The 20-day EMA sits at $212.48 and the 50-day EMA at $217.99, both above spot. Trading below the 20- and 50-day EMAs keeps the near-term bias tilted bearish and signals sellers still have the upper hand on rallies. The 200-day EMA at $222.52 is also overhead. This underlines that AMZN is working off prior strength rather than starting from depressed levels.
Meanwhile, daily momentum has cooled but not broken. The daily RSI at 45.25 is below the midpoint yet far from oversold. An RSI in the mid-40s typically points to a controlled pullback rather than capitulation selling. The daily MACD line at -1.87 versus a signal of -2.68 leaves a positive histogram of 0.81. This MACD configuration shows downside momentum has been fading, with early signs of stabilization even as price remains under pressure.
Volatility on the daily chart is moderate. The ATR14 stands at 5.61, which is meaningful but not extreme for a large-cap like Amazon. ATR at these levels indicates active trading ranges, yet not the kind of panic expansion seen in stress events. Daily Bollinger Bands frame price with a middle band at $210.90, upper band at $218.03, and lower band at $203.77. Yesterday’s close just under the mid-band, and well above the lower band, suggests a mid-range consolidation rather than a test of extremes.
From a levels perspective, the daily pivot at $211.28 is now just above spot, with first resistance (R1) at $213.73 and first support (S1) at $207.42. Closing beneath the daily pivot keeps the short-term tone defensive, while the $207–208 area emerges as the first meaningful downside zone for dip buyers to watch.
Intraday Structure for Amazon Stock Today: Hourly Chart Tempers the Bearish Case
On the 1-hour timeframe, the regime is labeled neutral, which already softens the outright bearish tilt of the daily chart for Amazon stock today. Price into the close hovered at $209.86, a touch above the hourly pivot at $209.59. Holding slightly above the hourly pivot, despite being below key moving averages, argues for a market that is pausing rather than breaking down intraday.
However, the hourly EMAs are still stacked above price. The 20- and 50-period EMAs cluster around $211.5, with the 200-period EMA higher at $213.97. This short-term configuration confirms that rallies toward the low-$210s are meeting supply, reinforcing the daily picture of a controlled downtrend or sideways digestion.
The hourly RSI near 41.68 stays in the lower half of its range. RSI in the low 40s reflects persistent, but not aggressive, selling pressure over recent sessions. The hourly MACD line at -0.06 versus a signal of 0.32 generates a negative histogram of -0.38. This MACD setup points to mild intraday downside momentum, yet the small magnitude hints at a grinding, not impulsive, move lower.
Bollinger Bands on the 1-hour chart show a mid-band at $211.94, with the upper band at $215.67 and lower band at $208.20. Price near the lower half of the band structure, but not hugging the band, is consistent with a gentle drift lower rather than a momentum breakdown. Hourly ATR14 at 1.48 indicates typical bar-to-bar ranges just under $1.50. This signals intraday swings that are tradable but not disorderly, which matters for tactical entries and exits around the current zone.
15-Minute Context: Short-Term Pressure into the Close
Zooming into the 15-minute chart for execution context, AMZN ended the session under its short-term moving averages. The 15-minute 20 EMA is at $210.88, with the 50 EMA at $211.57 and the 200 EMA at $211.43, all above the last trade. This alignment confirms short-term selling pressure late in the day and suggests that intraday bounces are being sold near the $211 area.
The 15-minute RSI at 35.08 is the weakest of the three timeframes. RSI in the mid-30s shows short-horizon traders leaning more aggressively to the sell side, but it also brings AMZN closer to near-term oversold territory where snap-back moves are common. The 15-minute MACD line at -0.79 versus a signal of -0.68 produces a slightly negative histogram of -0.11. This modest negative histogram indicates that downside momentum is present but not accelerating into a late-session flush.
On this micro timeframe, Bollinger Bands have a mid at $210.90, upper at $212.54, and lower at $209.26. With price closing right above the lower band, AMZN is stretched on a very short-term basis, which often sets up either a pause or a small relief bounce early in the next session. The 15-minute pivot at $209.59, with R1 at $210.34 and S1 at $209.10, also frames the immediate trading box. Closing just above the pivot and just below the local resistance leaves the stock in a tight near-term balance area.
News and Narrative: Fundamental Backdrop Still Constructive
Beyond the charts, the newsflow around Amazon remains broadly supportive, even as the share price consolidates. Recent analyst work has highlighted AMZN as undervalued, with upside driven by AI-led AWS growth, OpenAI-related deals, and new verticals. Calls for long-term targets well above current levels signal that institutional research desks still frame the stock as a growth compounder rather than a value trap.
Moreover, a BofA Securities note reaffirmed a Buy rating with a $275 price objective, citing continued e-commerce market share gains and strong engagement from merchants and brands. This points to a fundamental story in which both core retail and AWS engines remain healthy, even if the stock is currently digesting past gains. The report also underscored that many Amazon sellers have been able to hold pricing despite rising costs. That dynamic supports margin resilience, which is critical when the market is refocusing on earnings quality in large-cap tech.
Separately, an appeals court decision allowing Perplexity AI’s shopping bot to continue operating on Amazon for now keeps an emerging AI-commerce angle in play. While the immediate financial impact is limited, it underscores Amazon’s central role as an infrastructure layer for third-party AI-driven commerce tools.
Main Scenario for Amazon Stock Today: Mildly Bearish Within a Larger Range
Pulling the pieces together, the dominant scenario for Amazon stock today is a mildly bearish, range-bound consolidation. The daily timeframe carries an explicitly bearish regime tag, with price below the 20-, 50-, and 200-day EMAs and closing under the daily pivot. That structure favors a cautious stance in the very near term, especially on rallies toward the mid- to high-$210s.
However, the hourly and 15-minute charts do not show a disorderly breakdown. Hourly momentum is weak but stabilizing, and the 15-minute RSI is already near short-term oversold conditions. This intraday picture complicates the daily bearish signal by arguing for a more measured drift lower, punctuated by tactical bounces rather than a one-way slide.
Overall, AMZN appears to be working through a pullback inside its Bollinger envelope on the daily chart, with volatility contained and fundamentals intact. For traders, that translates into an environment where fading strength near resistance remains the path of least resistance, but chasing weakness deep into support carries rising whipsaw risk.
What Would Support a Bullish Scenario?
A constructive, short-term bullish scenario would require the intraday structure to repair first, then feed into the daily chart. On the 15-minute and hourly timeframes, the first sign of a turn would be price reclaiming and holding above the $211–212 area, where the short-term EMAs and hourly Bollinger mid-band cluster. A decisive move back above those levels would hint that the recent selling has exhausted, with buyers comfortable stepping back in on dips.
From there, the next step would be a daily close back above the 20-day EMA at $212.48 and the daily pivot at $211.28, ideally on solid volume. A close above the 20-day EMA would signal that the current dip has been absorbed and that the path toward the 50-day EMA near $218 is reopening. If that recovery is accompanied by a daily RSI turning back above 50 and a growing positive MACD histogram, the shift in momentum would look more durable. Such a configuration would mark a transition from pullback to renewed up-leg within the broader growth narrative supported by recent bullish analyst commentary.
On a news front, any incremental catalyst around stronger-than-expected AWS growth, clearer monetization of AI partnerships, or upbeat commentary on consumer demand could help validate the upside technical break. In a market that is sensitive to both growth and margins, positive revisions or confident guidance would likely be rewarded with stronger follow-through after an initial technical breakout.
What Would Confirm a Bearish Scenario and Invalidate the Bullish Case?
On the other hand, the bearish scenario would firm up if Amazon fails repeatedly to reclaim the $211–213 band and instead breaks lower through nearby daily support. A clean daily close below $207.42 (daily S1) would be the first warning that buyers are stepping aside. Such a move would shift focus toward the lower daily Bollinger Band near $203.77 as the next logical downside magnet.
In that situation, traders would look for the daily RSI to slip toward the high 30s and the MACD histogram to roll back into more negative territory. That combination would indicate that the controlled pullback is evolving into a more directional downswing, with momentum aligning more clearly with the already-bearish regime tag on the daily chart.
Shorter term, if AMZN begins to hug the lower hourly and 15-minute Bollinger Bands while hourly ATR picks up, the market tone would shift from orderly distribution to a more aggressive de-risking phase. Breaking below $209.10 (15-minute and hourly S1) with sustained selling pressure would reinforce that bears are in tactical control intraday.
Fundamentally, any disappointment around cloud growth, AI monetization, or signs of pressure on marketplace margins could add fuel to a technical breakdown. If the narrative shifts from “undervalued compounder” to “earnings risk,” the downside levels on the chart are more likely to be tested and to hold as resistance on rebounds.
Positioning, Volatility, and Uncertainty for Amazon Stock Today
In the near term, Amazon stock today sits in the middle ground between its bullish long-term story and a tactically bearish daily setup. Price trades under key daily moving averages, yet volatility remains contained and intraday charts are closer to exhaustion than to fresh acceleration. This mix argues for a focus on levels and timing rather than broad directional conviction.
Therefore, short-horizon participants will likely key off the $207–213 range as the immediate decision zone. Breaks above or below that band, combined with shifts in RSI and MACD momentum, will provide clearer evidence of whether this is a routine consolidation before another leg higher, or the early stages of a deeper correction. Until that resolution arrives, Amazon remains a technically fragile but fundamentally supported name, with positioning and risk management more important than bold directional bets.
You May Also Like

Gold Hits $3,700 as Sprott’s Wong Says Dollar’s Store-of-Value Crown May Slip

XRP Price Prediction As Bitcoin Dumps and New Ethereum Based Remittix Set To Skyrocket As Platform Launch Nears