Oil Price Is Still Dirt Cheap Compared to Gold: The Chart That Proves We’re in a New Era
A macro analyst just dropped a chart that puts the current commodity rally in perspective. Despite oil surging over 45% in the past month, priced in gold, it has barely budged.
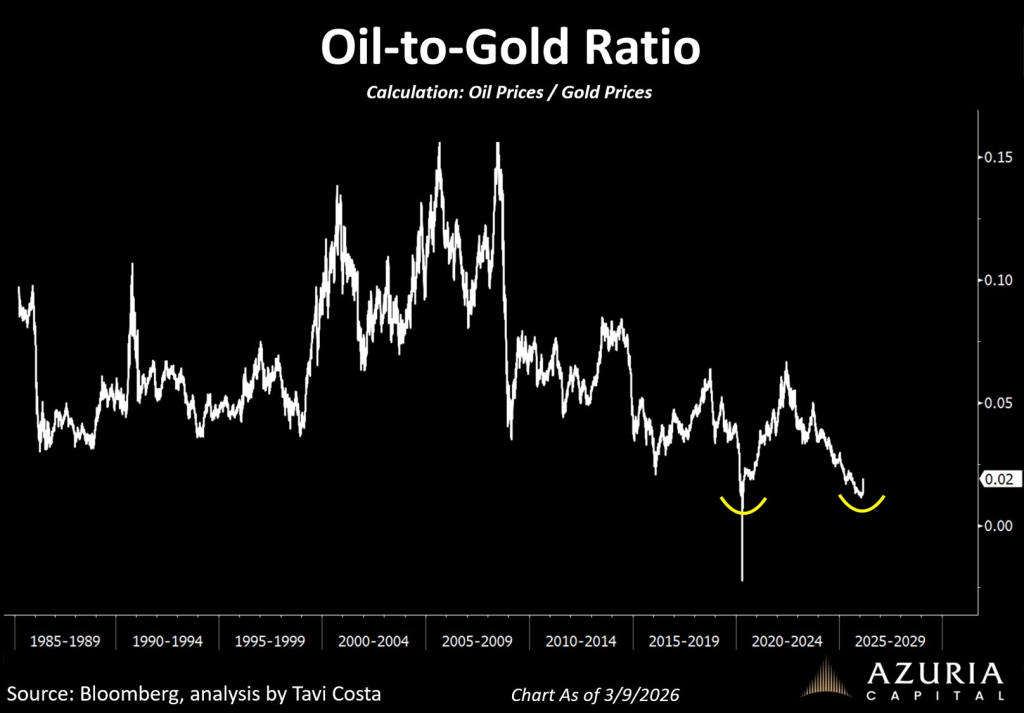
Otavio Costa shared the data on X, pointing out that the oil-to-gold ratio tells a story most traders are missing. Oil priced in gold hasn’t moved much in decades. That means either oil is still undervalued, or gold is sending a signal about where prices are heading.
Breaking Down the Chart
The table Costa shared shows the oil-to-gold ratio calculated over five-year periods since 1985:
- 1985-1989: 0.02
- 1990-1994: 0.05
- 1995-1999: 0.10
- 2000-2004: 0.15
- 2005-2009: 0.20
- 2010-2014: 0.25
- 2015-2019: 0.30
- 2020-2024: 0.35
- 2025-2029: 0.40
The pattern is clear. Each five-year period since 1985 has seen the ratio climb by roughly 0.05. It moved from 0.02 in the late 80s to 0.40 projected for the late 2020s.
That steady climb tells us something important. The relationship between oil and gold trends in one direction over long timeframes.
 Source: X/@TaviCosta
Where We Are Today
Oil prices have gone vertical lately. Brent crude hit $100.16 per barrel on March 13, down slightly from recent peaks but up massively from $69-$70 levels a month ago. That’s a 45% gain in 30 days. WTI trades around $99.31, up 3.74% just yesterday.
The reason? Middle East tensions are hitting fever pitch. The Strait of Hormuz, through which 20% of global oil supply moves, faces closure risks. US and Israeli strikes on Iran have escalated. Markets are pricing in supply disruption like we haven’t seen in years.
Gold sits at $5,019-$5,021 per ounce as of March 14, down about 1.5% from the previous day. Earlier this month, it touched $5,289 before pulling back to $5,064. The dollar strengthened, which pressured gold, but safe-haven demand from all these conflicts kept a floor under price.
Year over year, gold is up over $2,100 per ounce. Some forecasts see $5,500 soon on central bank buying alone.
What Costa’s Chart Really Shows
Here’s the insight that matters. Oil price in dollars went parabolic. But oil priced in gold? Barely moved.
When you divide oil price by gold price, you strip away dollar noise. You see the real relationship between two hard assets.
If oil were truly expensive relative to gold, that ratio would spike. It hasn’t. The ratio sits right where the multi-decade trendline says it should.
That tells Costa, and anyone paying attention, that oil may still be cheap. The rally in dollars looks huge, but measured against real money (gold), oil hasn’t run away at all.
Read also: Robert Kiyosaki’s Warning: Bitcoin, Silver, and Oil Are Your Only Shields Against the Coming Debt Collapse
Not Negative for Gold
Costa makes a point to say this isn’t bearish for gold. If anything, it reinforces the idea that we’re entering an era of structurally higher natural resource prices.
Think about it. Gold holds its value against oil over decades. That means both are moving higher together in dollar terms. The ratio trends up slowly, but the denominator and numerator both climb.
We’re looking at a regime shift. The days of cheap energy and stable commodity prices are fading. Central banks can’t print more oil. They can’t print more gold. They can only print more dollars, which makes both assets more expensive in paper currency terms.
The Strait of Hormuz is the world’s most important oil chokepoint. If that closes, 20% of global supply disappears overnight. Prices don’t go to $100. They go to wherever buyers panic-bid them.
The US and Israel striking Iran removes any doubt about escalation. This isn’t a drill. It’s happening now.
Gold responds to the same fears. When empires clash and trade routes close, people want metal they can hold. Paper promises lose appeal.
Subscribe to our YouTube channel for daily crypto updates, market insights, and expert analysis.
The post Oil Price Is Still Dirt Cheap Compared to Gold: The Chart That Proves We’re in a New Era appeared first on CaptainAltcoin.
You May Also Like

Veteran Investor: From What I Am Hearing, the Switch for XRP Has Just Been Flicked

Researcher Acquires Former Crypto Launchpad Cardence.io to Launch ‘Market Forensic’ Blog