

XRP Long-Term Chart Proves the Uptrend Is Still Alive: $18 Could Be the Next Big Price Target
Despite the struggles that XRP has faced over the years, the price has continued to trade inside a clear structure that becomes visible on a wider zoom. A chart shared by an analyst shows a formation that has guided the Ripple token for more than a decade.
That structure has shaped many of the major XRP price moves since 2014. Current positioning on the chart now gives a clearer sense of direction, even though exact timing remains uncertain.
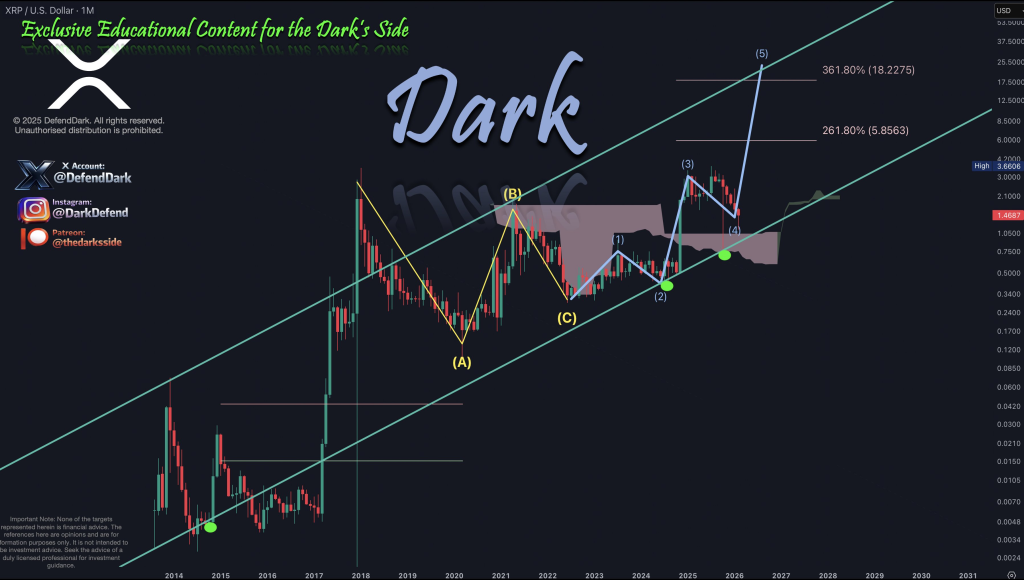
Dark Defender, known on X as @DefendDark, highlighted this structure in a recent post. He explained that XRP has progressed inside an ascending trend channel since 2017 and that a W pattern now intersects a Fibonacci level near $18. His view centers on the idea that long term structure carries more weight than short term volatility for the Ripple asset.
 @DefendDark / X
The long term XRP chart shows higher lows forming inside a rising channel that began years ago. Each major correction stayed above the previous structural floor. That behavior often signals sustained accumulation across extended market cycles.
Dark Defender’s focus on a W pattern adds another technical layer. A W pattern forms when price creates two major bottoms separated by a recovery phase. The second bottom usually holds above or near the first.
Breakout confirmation appears once price clears the midpoint resistance between both lows. Analysts often interpret that move as the start of a stronger upward phase.
Intersection of this W structure with a Fibonacci projection near $18 creates the main thesis behind the forecast. Fibonacci extensions estimate how far price could travel once a breakout holds. Placement of the extension at the upper boundary of the long term channel strengthens the analytical case for that region as a future target zone for XRP price.
Monthly Indicators From Investing.com Show Mixed Signals That Lean Neutral To Bullish
Monthly timeframe indicators sourced from Investing.com provide broader context beyond the chart pattern alone. These readings smooth out short term volatility and highlight structural momentum.
| Name | Value | Action |
|---|---|---|
| RSI (14) | 46.632 | Neutral reading that shows balance between buyers and sellers |
| STOCH (9,6) | 37.747 | Sell pressure still present but not extreme |
| MACD (12,26) | 0.244 | Buy signal that hints at slow positive momentum |
| Williams %R | -85.932 | Oversold zone that often appears near long term bottoms |
| Ultimate Oscillator | 43.818 | Weak momentum but not deep bearish territory |
Several important signals stand out. RSI remains neutral, which means XRP price sits near equilibrium on a long horizon. MACD shows a buy signal even on the monthly scale. Oversold positioning in Williams percent range often appears before extended recoveries. Monthly data moves slowly, so these readings describe structural positioning rather than immediate direction.
Long-Term Moving Averages Support A Bullish XRP Price Foundation
Moving averages on the same monthly timeframe add another confirmation layer for Ripple’s trend strength.
| Name | Simple | Exponential |
|---|---|---|
| MA10 | 2.2689 — Sell | 2.0003 — Sell |
| MA20 | 1.9248 — Sell | 1.8517 — Sell |
| MA50 | 1.0797 — Buy | 1.3339 — Buy |
| MA100 | 0.7835 — Buy | 1.0884 — Buy |
| MA200 | 0.3917 — Buy | 1.0112 — Buy |
Shorter averages still lean bearish because XRP price trades below recent cycle highs. Longer duration averages remain firmly bullish. Price staying above MA50, MA100, and MA200 on a monthly basis often signals preservation of the primary uptrend.
Read Also: Is Gold a Good Investment? Paper vs Physical Gold Is at an All-Time Extreme
This alignment between structural chart pattern, Fibonacci projection, neutral momentum indicators, and supportive long term averages creates a consistent analytical narrative. XRP price continues to respect a rising framework that has guided the Ripple asset for years.
Subscribe to our YouTube channel for daily crypto updates, market insights, and expert analysis.
The post XRP Long-Term Chart Proves the Uptrend Is Still Alive: $18 Could Be the Next Big Price Target appeared first on CaptainAltcoin.
You May Also Like

Trump adviser demands Fed economists be 'disciplined' for arguing with presidential tactic

Trump admin appeals after judge orders slavery exhibit returned to Philadelphia museum
