

XRP Price Enters Reset Phase as Key Indicator Hits Extreme Lows
- XRP trades at $1.567 with RSI at 27.03, indicating oversold conditions and potential short-term bounce ahead.
- EGRAG CRYPTO identifies this as a reset phase, not reversal, with 45-50 RSI zone historically holding strong.
- Recent 74M volume spike confirms large holder distribution, while $1.525 support level remains critical.
XRP has entered a steep downtrend, currently trading around $1.567 on the daily chart. The digital asset shows consecutive lower lows and lower highs, signaling sustained bearish momentum.
Price action approaches the lower Bollinger Band at $1.5259, reflecting intense selling pressure. However, technical indicators suggest the market may be nearing oversold conditions.
Technical Indicators Show Extreme Oversold Territory
The Relative Strength Index sits at 27.03, well below the critical 30 threshold. This marks deeply oversold conditions not seen in recent months.
The 14-day RSI average stands at 35.65, confirming the downward pressure. Bollinger Bands reveal telling details about current market structure.
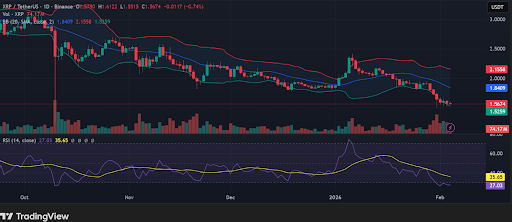 XRP price action approaches the lower Bollinger Band, Source: TradingView
The upper band reaches $2.1558 while the middle SMA sits at $1.8409. XRP trades significantly below this middle band, reinforcing the bearish bias. The lower band’s slight flattening hints at possible short-term consolidation ahead.
Recent volume data adds another layer to the picture. A spike to approximately 74 million coincides with strong bearish candles. This confirms that selling pressure remains significant and deliberate.
Expert Identifies Full Reset Phase
Crypto analyst EGRAG CRYPTO shared a macro perspective on XRP’s RSI behavior. The analyst noted the RSI reached the 50 zone faster than expected. Historically, this level triggers violent bounces in XRP price action.
According to EGRAG CRYPTO, the current movement reflects distribution by large holders. The analyst emphasized this selling pressure does not come from retail panic. Instead, market makers appear to be conducting liquidity sweeps by pushing prices deeper.
The analyst described this RSI behavior as a “Full Reset Phase” rather than bearish reversal. Previous cycles show the 45-50 macro support band has never broken. Each compression at this zone preceded momentum expansion.
EGRAG CRYPTO outlined specific markers for tracking the reset. The RSI topped near 80 after the recent run, representing normal cooldown. The current position in the 45-50 support band maintains structural integrity. A break below 43 would signal genuine concern.
Support Levels and Recovery Scenarios
Immediate support sits between $1.525 and $1.530, aligning with the lower Bollinger Band. Recent price lows also cluster around this zone. A breach could trigger further downside movement.
Recovery requires substantial effort from bulls. Price must reclaim $1.84, the middle Bollinger Band, to shift momentum. The upper band at $2.155 represents a longer-term resistance target.
The analyst’s framework suggests weak hands exit during these compressions. Momentum resets as distribution completes. Expansion typically follows once the reset phase concludes.
EGRAG CRYPTO maintains that cooling does not equal collapse in this scenario. The distinction between reset and reversal remains critical for understanding market structure. According to the analyst, structure stays intact above the 43 RSI level.
The crypto community watches these technical levels closely as XRP navigates this volatile period.
The post XRP Price Enters Reset Phase as Key Indicator Hits Extreme Lows appeared first on Live Bitcoin News.
You May Also Like

Top Altcoins To Hold Before 2026 For Maximum ROI – One Is Under $1!

UBS CEO Targets Direct Crypto Access With “Fast Follower” Tokenization Strategy
