

Why Crypto Market Is Down Today: Bitcoin, Altcoins Slide After Fed Update

The post Why Crypto Market Is Down Today: Bitcoin, Altcoins Slide After Fed Update appeared first on Coinpedia Fintech News
Bitcoin and altcoins are falling today, extended selloff after the Federal Reserve delivered its latest policy decision, keeping interest rates unchanged. While the move itself was widely expected, markets reacted to the absence of fresh dovish signals, prompting traders to reduce risk across speculative assets.
Bitcoin slipped as selling pressure resurfaced near key resistance, dragging major altcoins lower. The price action suggests caution rather than fear, a market adjusting to tighter liquidity conditions and fading demand rather than reacting to a single negative headline.
Liquidation Data Confirms Leverage Reset, Not Panic
Liquidation data shows that derivatives markets have amplified the move though forced leveraging. In the past 24 hours, BTC liquidations exceeded $134 million and ETH liquidations surpassed $50 million. The concentration of liquidations in BTC and ETH shows that leveraged long positions have flushed, while smaller altcoins saw comparatively lighter forced exits.
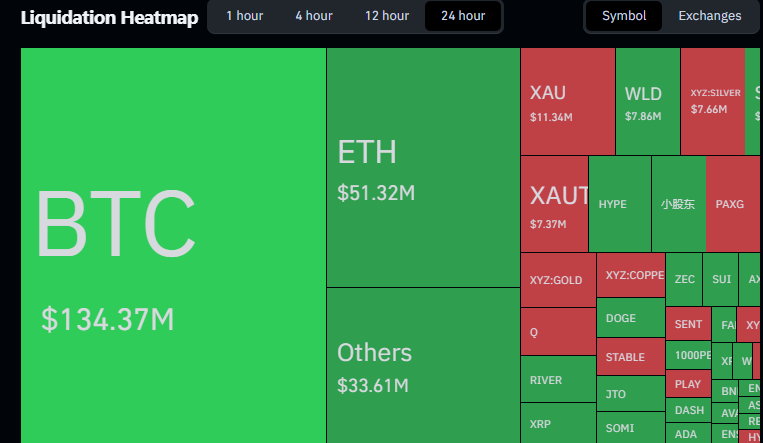
This profile is typical of a controlled leverage reset, not a market-wide capitulation. Notably, liquidation levels remain below historical extremes, suggesting selling pressure is mechanical rather than emotional.
Macro and News Factors Add to Risk-Off Tone
The Fed’s decision to hold rates steady removed a potential catalyst for risk assets. With no clear signal of imminent rate cuts, traders have shifted into a more defensive posture. Meanwhile, capital continues to rotate toward U.S. equities and gold, both of which are outperforming crypto. This divergence has historically coincided with consolidation or corrective phases for Bitcoin, especially when internal liquidity conditions are weak.
Without supportive macro tailwinds, crypto markets remain vulnerable to downside probes.
On-Chain Liquidity Signals Point to Liquidity Exit
On-chain data shows the sell-off is being driven by liquidity leaving the system, not fear-driven dumping.
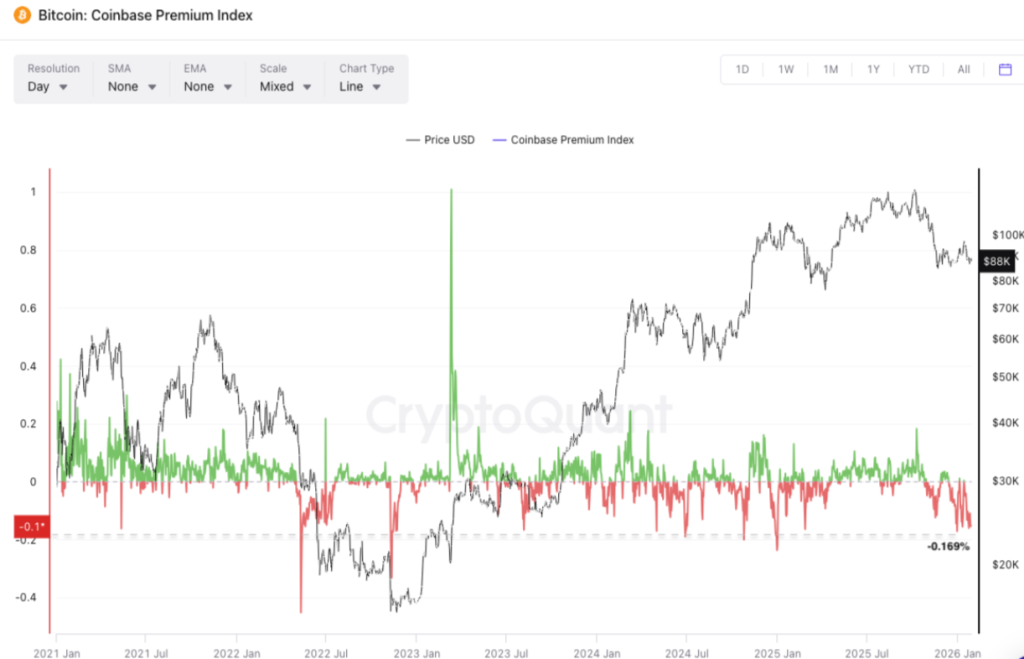
The Coinbase Premium Index remains deeply negative near -0.16%. This indicates that Bitcoin is consistently trading at a discount on Coinbase relative to offshore exchanges, a sign of institutional selling during U.S. hours.
At the same time, stablecoin market capitalization is shrinking, with more than $2.2 billion recently exiting circulation and a broader decline exceeding $5.5 billion from peak levels. Instead of rotating into stablecoins to buy dips, capital is moving back into fiat and other asset classes.
This combination, negative Coinbase premium and shrinking stablecoin supply, historically suppresses recovery attempts and limits upside follow-through. The current data shows buyer participation without conviction, a market state where rallies lack follow-through and are vulnerable to renewed selling pressure.
Bitcoin Price Action: Key Levels To Watch
Bitcoin price action showcases weakness and may see further decline in the coming sessions. Based on the chart structure, BTC price may retest the demand zone of $86,000 and grab liquidity from there. Afterward, an upswing toward $88,000 followed by $90,000 could be anticipated ahead.
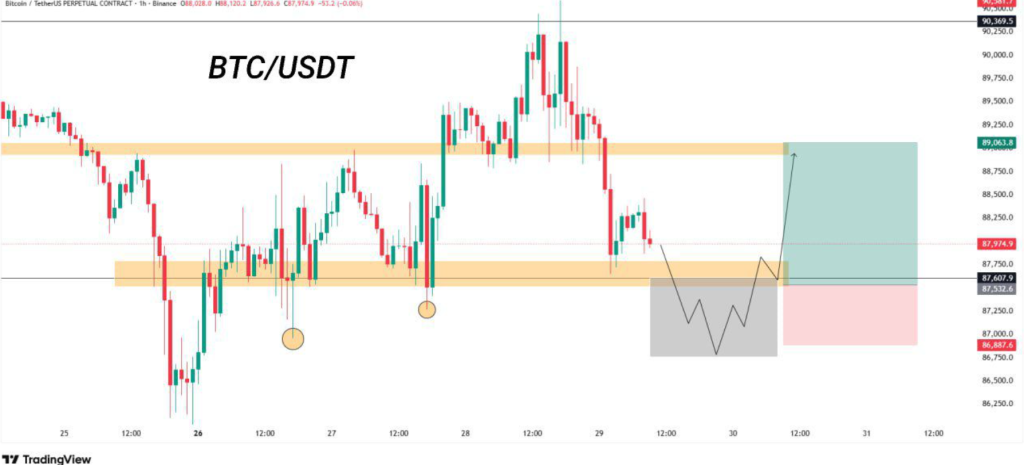
In the near term, BTC price may continue to underperform and may influence other altcoins to face selling pressure. As long as BTC price remains below $90k, upside moves are likely to be corrective.
What Comes Next for Bitcoin and Altcoins
The near-term outlook hinges on liquidity and demand returning. If the market sentiment remains positive and stablecoin supply expands alongside the positive coinbase premium, a significant bullish market could be seen. Until these signals align, rallies are likely to face resistance. For now, the market remains defensive. The next direction will depend less on headlines and more on whether capital returns.
FAQs
Bitcoin and altcoins fell because the Fed held rates steady without signaling cuts, reducing risk appetite and pushing traders away from speculative assets.
This move reflects a leverage reset, not panic. Liquidations remain moderate, showing mechanical selling rather than fear-driven capitulation.
Declining stablecoin supply signals capital leaving crypto, reducing liquidity and making rallies weaker and more vulnerable to pullbacks.
You May Also Like

Securities Fraud Investigation Into Corcept Therapeutics Incorporated (CORT) Announced – Shareholders Who Lost Money Urged To Contact Glancy Prongay Wolke & Rotter LLP, a Leading Securities Fraud Law Firm

Microsoft Corp. $MSFT blue box area offers a buying opportunity
