

Chainlink rallies 12% after Grayscale drops first LINK ETF
Chainlink finally got the Wall Street makeover it’s been hinting at for years.
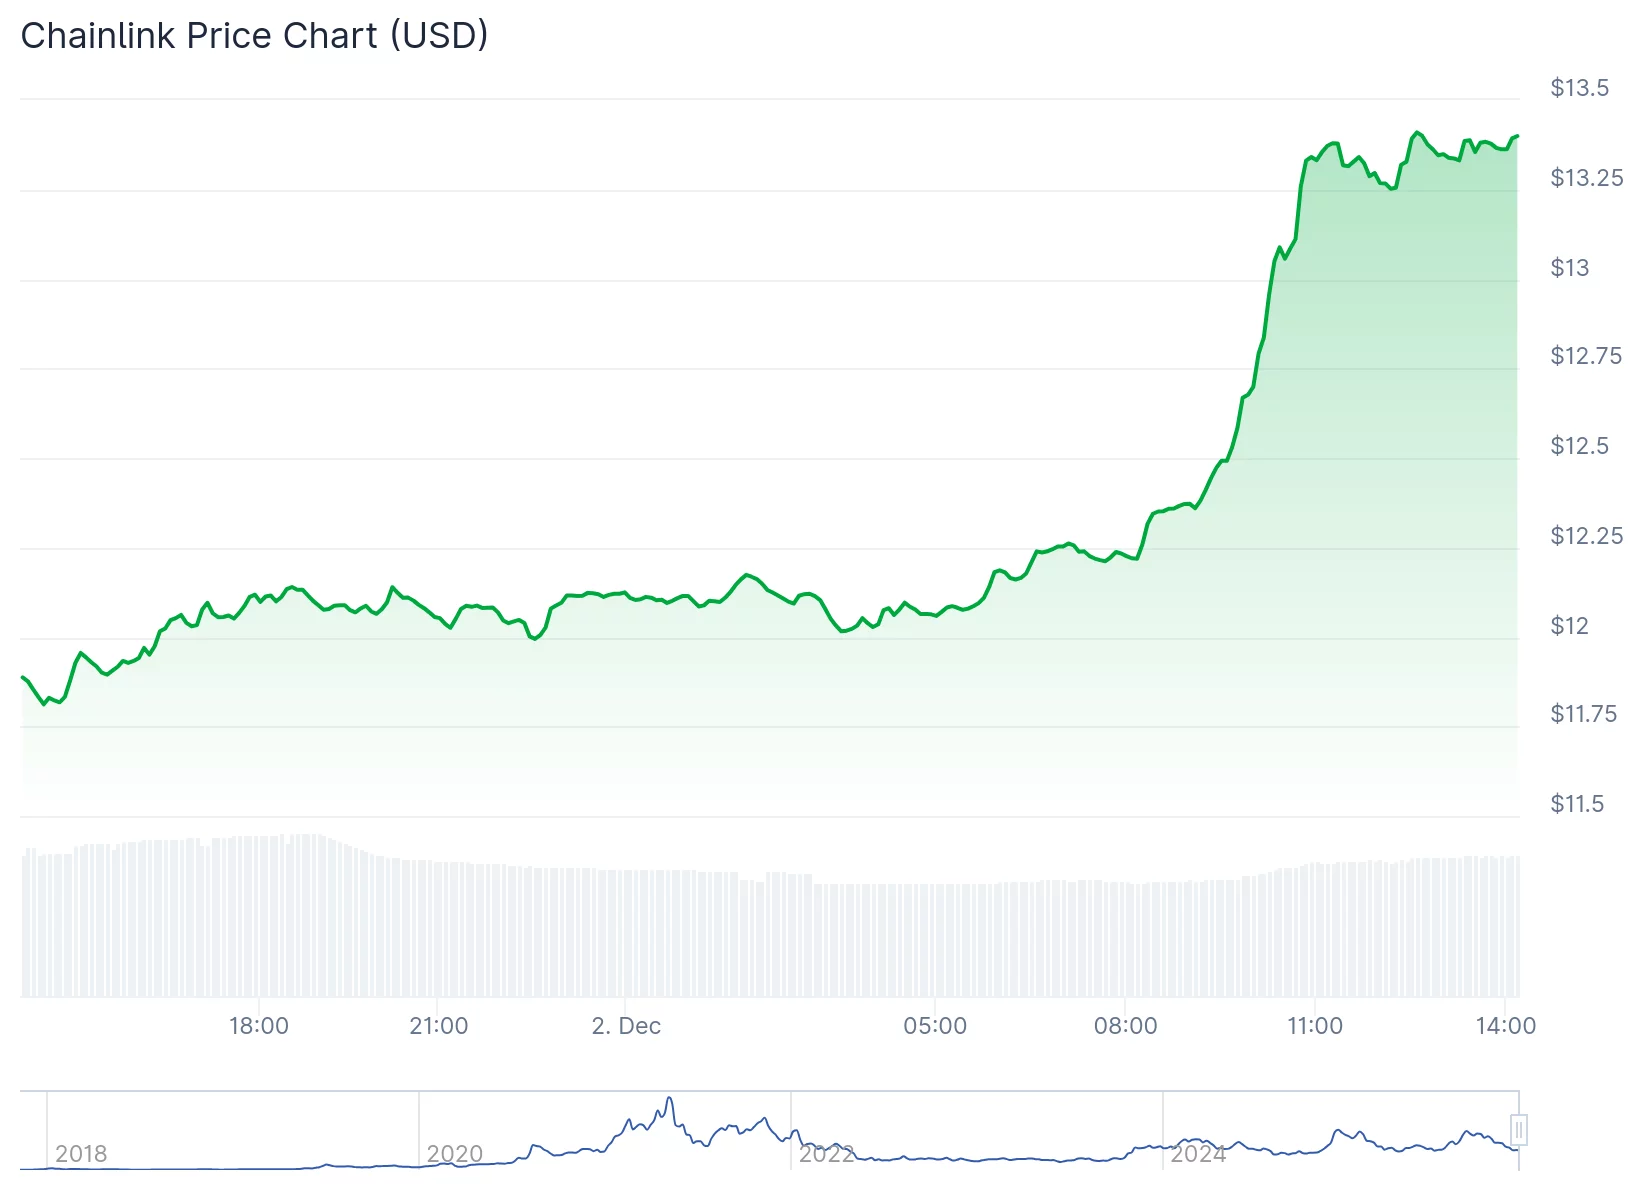
Once Grayscale rolled out the exchange-traded fund tied to LINK, the token rallied. At last check on Tuesday, it was up 12.7% to $13.40 — a welcome bounce for an asset that’s been slogging through a rough year.
- LINK jumps 8% after Grayscale launches the first U.S. ETF dedicated to the Chainlink token.
- GLNK offers regulated exposure to LINK but isn’t a traditional 1940 Act ETF.
- The debut comes as LINK remains down nearly 40% on the year.
LINK technicals
Trading under the ticker GLNK, the new Grayscale fund gives investors an easy, brokerage-friendly way to get exposure to Chainlink without having to explain private keys to their financial advisor.
It’s the first U.S. ETF dedicated to tracking LINK, the engine behind Chainlink’s decentralized oracle network — the tech that feeds smart contracts everything from weather alerts to price feeds to who won last night’s election.
Chainlink superpower
Since Chainlink was founded in 2014 by Sergey Nazarov and Steve Elli, it has made it indispensable across DeFi, gaming, NFTs, and a slew of onchain markets, where it helps secure tens of billions of dollars in value, according to Grayscale.
One caveat for eager buyers: GLNK isn’t a traditional Investment Company Act ETF, CoinDesk reports. It simply holds LINK on behalf of shareholders and doesn’t come with all the consumer protections of more buttoned-up funds.
Still, the NYSE Arca listing marks a big leap from its days as a 2021 private placement and later as an OTC Markets product. For both institutions and retail traders, LINK just became a whole lot easier to access — which, given its 39% slide this year, might feel like the confidence boost it needed.
You May Also Like

Securities Fraud Investigation Into Corcept Therapeutics Incorporated (CORT) Announced – Shareholders Who Lost Money Urged To Contact Glancy Prongay Wolke & Rotter LLP, a Leading Securities Fraud Law Firm

Microsoft Corp. $MSFT blue box area offers a buying opportunity
