

Arbitrum (ARB) Price Prediction 2026, 2027-2030
- Bullish ARB price prediction for 2026 is $0.2271 to $0.3491.
- Arbitrum (ARB) price might reach $2 soon.
- Bearish ARB price prediction for 2026 is $0.0767.
In this Arbitrum (ARB) price prediction 2026, 2027-2030, we will analyze the price patterns of ARB by using accurate trader-friendly technical analysis indicators and predict the future movement of the cryptocurrency.
|
TABLE OF CONTENTS
|
|
INTRODUCTION
|
|
|
ARBITRUM (ARB) PRICE PREDICTION 2026
|
|
| ARBITRUM (ARB) PRICE PREDICTION 2027, 2028-2030 |
| CONCLUSION |
| FAQ |
Arbitrum (ARB) Current Market Status
| Current Price | $0.1273 |
| 24 – Hour Price Change | 5.31% Down |
| 24 – Hour Trading Volume | $194.96M |
| Market Cap | $741.96M |
| Circulating Supply | 5.61B ARB |
| All – Time High | $2.40 (On Jan 12, 2024) |
| All – Time Low | $0.1239 (On Feb 05, 2026) |
What is Arbitrum (ARB)
| TICKER | ARB |
| BLOCKCHAIN | Ethereum |
| CATEGORY | Layer 2 Scaling Solution |
| LAUNCHED ON | August 2021 |
| UTILITIES | Governance, security, gas fees & rewards |
Arbitrum is a new layer-2 scaling solution for the Ethereum blockchain developed by a new york based company known as Off-chain labs. Layer-2 scaling solutions are networks which sit on top of layer 1 blockchains to provide cheap and fast transactions. They reduce the congestion on the main blockchain by validating transactions separately and integrating them into the main chain.
After its mainnet launch last year, Arbitrum’s scaling solution has seen a lot of success. As a result of this, several developers have used Arbitrum’s solutions to host their dApps. Arbitrum also supports integration with Ethereum Virtual Machine (EVM) making it easy for developers.
Arbitrum 24H Technicals
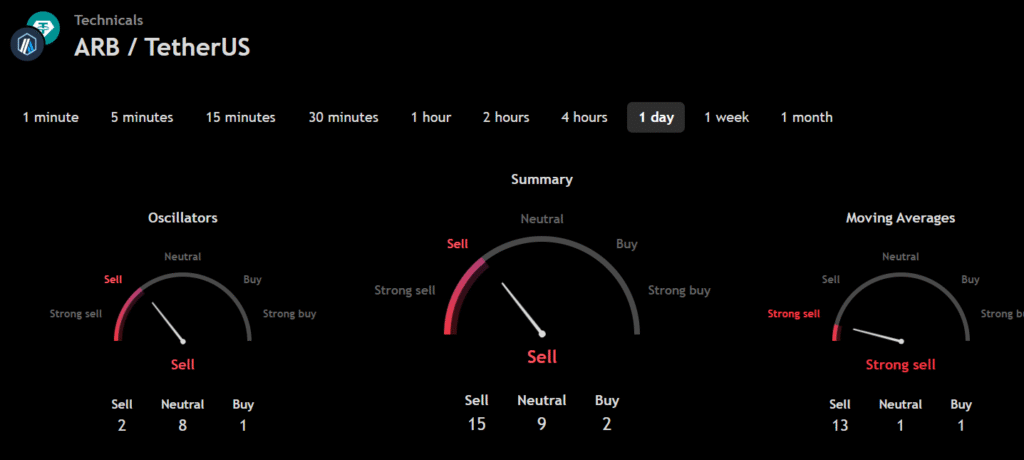 (Source: TradingView)
Arbitrum (ARB) Price Prediction 2026
Arbitrum (ARB) ranks 70th on CoinMarketCap in terms of its market capitalization. The overview of the Arbitrum price prediction for 2026 is explained below with a daily time frame.
In the above chart, Arbitrum (ARB) laid out a Horizontal channel pattern. The Horizontal channel pattern is also known as the sideways trend. In general, the horizontal channel is formed during the price consolidation. In this pattern, the upper trendline, the line that connects the highs, and the lower trendline, the line that connects the lows, run horizontally parallel, and the price action is contained within it.
A horizontal channel is often regarded as one of the suitable patterns for timing the market, as the buying and selling points are in consolidation.
At the time of analysis, Arbitrum (ARB) was recorded at $0.1280. If the pattern trend continues, then the price of ARB might reach the resistance level of $0.1309 and $0.1353. If the trend reverses, then the price of ARB may fall to the support levels of $0.1288 (crossed) and $0.1266.
Arbitrum (ARB) Resistance and Support Levels
The chart given below elucidates the possible resistance and support levels of Arbitrum (ARB) in 2026.
From the above chart, we can analyze and identify the following as resistance and support levels of Arbitrum (ARB) for 2026.
| Resistance Level 1 | $0.2271 |
| Resistance Level 2 | $0.3491 |
| Support Level 1 | $0.1245 |
| Support Level 2 | $0.0767 |
Arbitrum (ARB) Price Prediction 2026 — RVOL, MA, and RSI
The technical analysis indicators such as Relative Volume (RVOL), Moving Average (MA), and Relative Strength Index (RSI) of Arbitrum (ARB) are shown in the chart below.
From the readings on the chart above, we can make the following inferences regarding the current Arbitrum (ARB) market in 2026.
| INDICATOR | PURPOSE | READING | INFERENCE |
| 50-Day Moving Average (50MA) | Nature of the current trend by comparing the average price over 50 days | 50 MA = $0.1853 Price = $0.1279 (50MA > Price) | Bearish/Downtrend |
| Relative Strength Index (RSI) | Magnitude of price change;Analyzing oversold & overbought conditions | 21.2024 <30 = Oversold 50-70 = Neutral >70 = Overbought | Oversold |
| Relative Volume (RVOL) | Asset’s trading volume in relation to its recent average volumes | Below cutoff line | Weak volume |
Arbitrum (ARB) Price Prediction 2026 — ADX, RVI
In the below chart, we analyze the strength and volatility of Arbitrum (ARB) using the following technical analysis indicators — Average Directional Index (ADX) and Relative Volatility Index (RVI).
From the readings on the chart above, we can make the following inferences regarding the price momentum of Arbitrum (ARB).
| INDICATOR | PURPOSE | READING | INFERENCE |
| Average Directional Index (ADX) | Strength of the trend momentum | 51.6344 | Very Strong Trend |
| Relative Volatility Index (RVI) | Volatility over a specific period | 19.69 <50 = Low >50 = High | Low volatility |
Comparison of ARB with BTC, ETH
Let us now compare the price movements of Arbitrum (ARB) with those of Bitcoin (BTC), and Ethereum (ETH).
From the above chart, we can interpret that the price action of ARB is similar to that of BTC and ETH. That is, when the price of BTC and ETH increases or decreases, the price of ARB also increases or decreases, respectively.
Arbitrum (ARB) Price Prediction 2027, 2028 – 2030
With the help of the aforementioned technical analysis indicators and trend patterns, let us predict the price of Arbitrum (ARB) between 2027, 2028, 2029, and 2030.
| Year | Bullish Price | Bearish Price |
| Arbitrum (ARB) Price Prediction 2027 | $4.5 | $0.09 |
| Arbitrum (ARB) Price Prediction 2028 | $5.2 | $0.08 |
| Arbitrum (ARB) Price Prediction 2029 | $6.7 | $0.07 |
| Arbitrum (ARB) Price Prediction 2030 | $7.5 | $0.06 |
Conclusion
If Arbitrum (ARB) establishes itself as a good investment in 2026, this year would be favorable to the cryptocurrency. In conclusion, the bullish Arbitrum (ARB) price prediction for 2026 is $0.3491. Comparatively, if unfavorable sentiment is triggered, the bearish Arbitrum (ARB) price prediction for 2026 is $0.0767.
If the market momentum and investors’ sentiment positively elevate, then Arbitrum (ARB) might hit $2. Furthermore, with future upgrades and advancements in the Arbitrum ecosystem, ARB might surpass its current all-time high (ATH) of $2.40 and mark its new ATH.
FAQ
1. What is Arbitrum (ARB)?
Arbitrum is a new layer-2 scaling solution for the Ethereum blockchain developed by a New York-based company known as Off-chain Labs.
2. Where can you purchase Arbitrum (ARB)?
Arbitrum (ARB) has been listed on many crypto exchanges, including BlueBit, Binance, UEEx, OKX, and Bybit.
3. Will Arbitrum (ARB) reach a new ATH soon?
With the ongoing developments and upgrades within the Arbitrum Platform, ARB has a high possibility of reaching its ATH soon.
4. What is the current all-time high (ATH) of Arbitrum (ARB)?
On January 12, 2024, ARB reached its new all-time high (ATH) of $2.40.
5. What is the lowest price of Arbitrum (ARB)?
According to CoinMarketCap, ARB hit its all-time low (ATL) of $0.136 on October 11, 2025.
6. Will Arbitrum (ARB) reach $2?
If Arbitrum (ARB) becomes one of the active cryptocurrencies that majorly maintain a bullish trend, it might rally to hit $2 soon.
7. What will be Arbitrum (ARB) price by 2027?
Arbitrum (ARB) price is expected to reach $4.5 by 2027.
8. What will be Arbitrum (ARB) price by 2028?
Arbitrum (ARB) price is expected to reach $5.2 by 2028.
9. What will be Arbitrum (ARB) price by 2029?
Arbitrum (ARB) price is expected to reach $6.7 by 2029.
10. What will be Arbitrum (ARB) price by 2030?
Arbitrum (ARB) price is expected to reach $7.5 by 2030.
Top Crypto Predictions
Pepe (PEPE) Price Prediction
Axie Infinity (AXS) Price Prediction
Sei (SEI) Price Prediction
Disclaimer: The opinion expressed in this chart is solely the author’s. It does not represent any investment advice. TheNewsCrypto team encourages all to do their own research before investing.
You May Also Like

CEO Sandeep Nailwal Shared Highlights About RWA on Polygon

Top AI Crypto Presales 2026: IPO Genie Crushes the Competition with Pre-IPO Deal Intelligence and Massive Upside
