

Hyperliquid Price Prediction 2028: Can Hype Go to $300?
HYPE is changing hands around $68.43 at the moment, sitting fairly close to its all-time high of $76.70.
The bigger question is where this token could realistically land by 2028.
The chart tells most of the story here, since HYPE has spent the past year putting together a structure that is worth unpacking properly before making any Hyperliquid price prediction 2028 call.
It currently ranks 10th among all cryptocurrencies, carrying a market cap close to $15.14 billion and a fully diluted value near $65 billion, out of a total supply of 955 million tokens.
Around 222 million of those tokens are already in circulation, which means there is still a meaningful amount of future supply to factor into any long-term view.
Hyperliquid Price Right Now:
|
Metric |
Value |
|
Current Price |
$68.43 |
|
Market Cap |
$15.14B |
|
24H Volume |
$410.73M |
|
Circulating Supply |
222,445,714 HYPE |
|
All-Time High |
$76.70 |
Hyperliquid ETF Data Today
Hyperliquid spot ETFs pulled in $21.18M in net inflows till 9July 2026.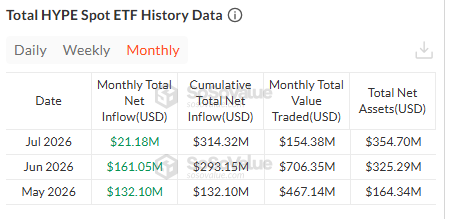
Total cumulative net inflow now stands at $314.32M, with monthly trading volume around $144.92M for July.
The slowdown over the past two months is hard to miss, though the broader trend hasn't actually reversed; institutional appetite has simply eased off its earlier pace.
Bitwise Adds HYPE to Its 10-Crypto Index Fund
Bitwise has added Hyperliquid to its 10 Crypto Index Fund (BITW), one of the largest crypto index products in the market, while dropping Polkadot and Avalanche from the lineup.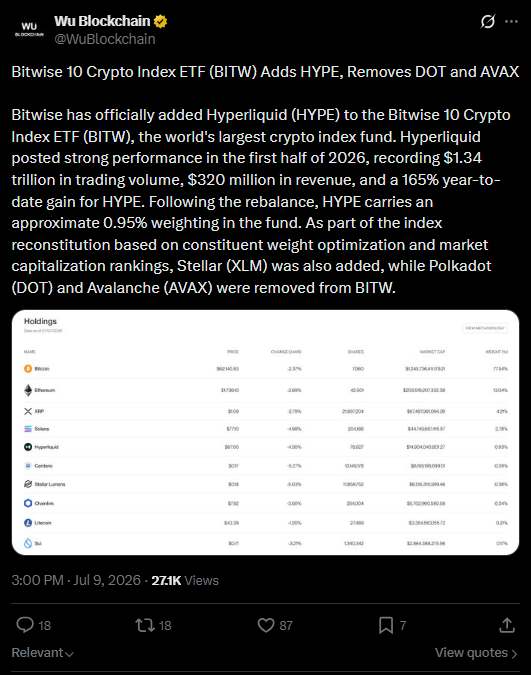
The change comes after HYPE posted a strong first half of 2026, with $1.34 trillion in trading volume, $320 million in revenue, and a 165% year-to-date gain.
Following the rebalance, HYPE now holds close to a 0.95% weighting in the fund.
Stellar was also added as part of the same reconstitution, based on updated market cap rankings.
Hyperliquid Chart Structure Right Now
On the weekly chart, HYPE has been riding a rising trendline for some time now, and price keeps treating that line as support almost every time it dips back down to test it.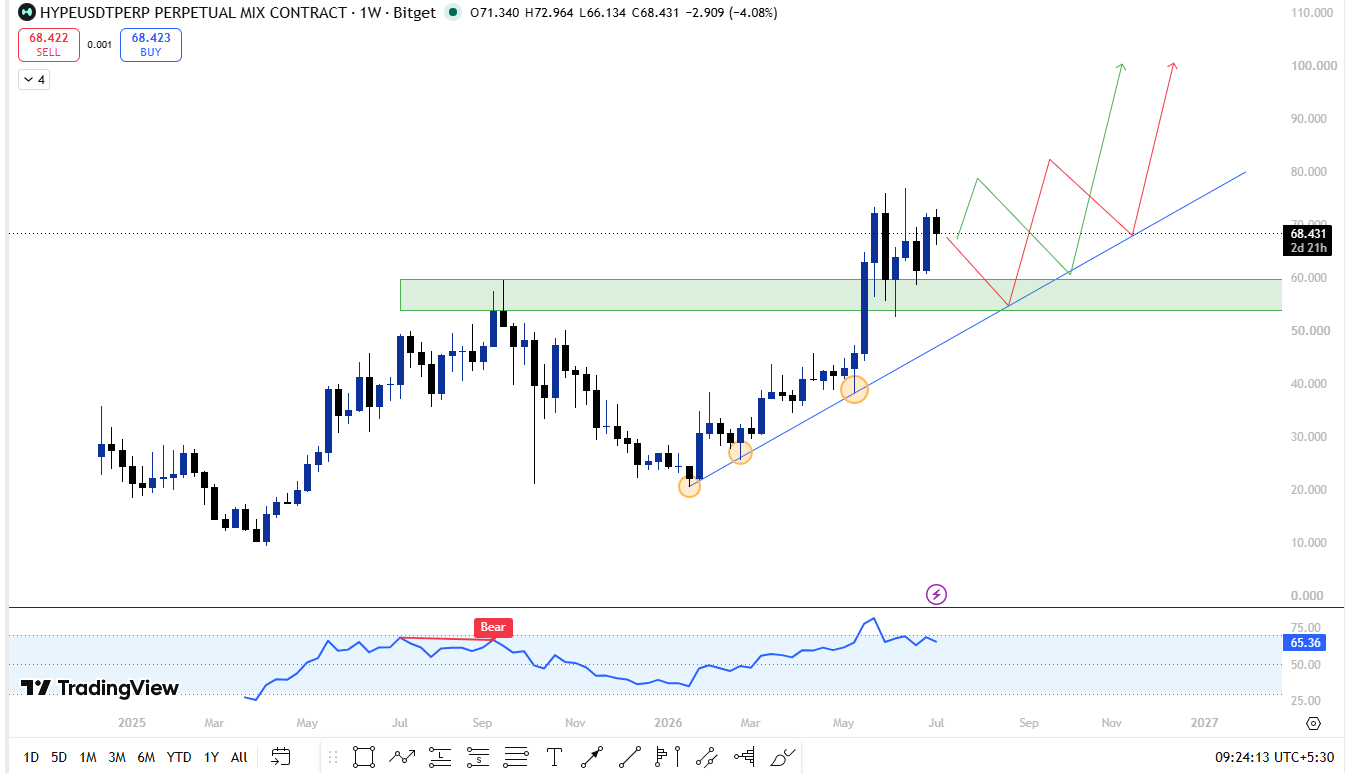
What makes this setup worth watching is the zone between $53.9 and $60. This area used to work against the price, rejecting it more than once in the past, but it has since flipped into a support zone.
At this point, that old resistance zone and the rising trendline are lining up almost at the same spot.
So if $HYPE does pull back from where it is now, both the flip zone and the trendline would be there to catch that move together, which makes it a stronger area of confluence rather than just one line on a chart.
The weekly RSI is reading around 65.36, pointing to solid bullish momentum without being anywhere near overbought yet.
That leaves room for price to keep climbing before RSI starts sending any real warning signs.
What This Flip Zone Means Going Forward
As long as HYPE keeps respecting the $53.9-60 zone along with the trendline sitting underneath it, the overall structure stays bullish.
A pullback into this area followed by a bounce would actually be a good sign; it would confirm that the old resistance has truly turned into support, which is usually how strong uptrends build out their next leg.
If HYPE holds this ground and pushes higher from here, the chart points toward a fresh attempt at the current all-time high of $76.70, with room to build an entirely new range above it over the next couple of years.
On the other hand, if this zone gives way and the trendline breaks along with it, that would be the first genuine sign that the uptrend built since last year is starting to lose strength and price would probably need to carve out a new base lower down before trying another run higher.
Hyperliquid Buybacks: A Built-In Supply Squeeze
HYPE does not have a halving event like Bitcoin, but it has its own way of tightening supply.
A large portion of the trading fees generated on Hyperliquid's exchange flows into an Assistance Fund, which is then used to buy back HYPE from the open market.
Instead of following a fixed schedule, this buyback moves in step with actual platform activity, so heavier usage on the exchange translates into steadier buying pressure.
This ongoing demand, paired with rising trading volumes across the platform, is one of the quieter but more important reasons HYPE has managed to hold its structure even when the broader market has looked weak.
Support and Resistance Levels
The $53.9-60 zone is the key support area to keep an eye on, especially with the rising trendline running right through the same range.
On the upside, the current all-time high near $76.70 is the level HYPE needs to clear to open the door to fresh price discovery.
Hyperliquid Price Prediction 2028: Three Scenarios
Bearish Scenario: If broader market conditions weaken and the $53.9-60 zone along with the trendline fails to hold,
HYPE could end up spending a good chunk of the next couple of years rebuilding a lower base, keeping 2028 targets in the $60-90 range.
Average Scenario: If HYPE manages to hold this flip zone and trendline structure and gradually clears its current all-time high, a realistic 2028 target lands somewhere between $150 and $220.
Bullish Scenario: A strong hold at the flip zone, combined with growing institutional access through products like the Bitwise index and steady buyback pressure from platform revenue, could push HYPE toward $300-$400 by 2028.
2028 Price Prediction Table
|
Scenario |
Target Range |
|
Bearish |
$60 - $90 |
|
Average |
$150 - $220 |
|
Bullish |
$300 - $400 |
Risk-Reward Snapshot
|
Factor |
Detail |
|
Key Support |
$53.9-60 |
|
Key Resistance |
$76.70 (ATH) |
The analysis above combines historical price structure with publicly available market data and should not be treated as a guarantee of future performance.
Is Hyperliquid a Good Long-Term Investment?
HYPE's chart shows a token that has managed to turn old resistance into fresh support, which is generally a healthy sign for a longer-term trend.
Right now, the $53.9-60 zone is the level that matters most. For anyone looking at a 2028 horizon, a pullback into this zone lining up with trendline support could be a reasonable spot to keep on the radar, especially with buyback demand and growing institutional interest working in the background.
Expert View
Sentiment around HYPE remains fairly constructive at the moment, with several analysts pointing to Hyperliquid's dominant share of on-chain perpetual trading volume as a core reason for long-term confidence.
The recent Bitwise index inclusion has also been flagged as an early sign of broader institutional acceptance.
That said, most seem to agree the $53.9-60 zone will be the real test of whether this uptrend structure can hold through any near-term volatility.
Conclusion
HYPE's chart really comes down to one key area right now, the $53.90-60 flip zone, which lines up almost perfectly with the rising trendline.
As long as this zone keeps acting as support the way it has recently, the path stays open toward new highs.
How HYPE handles this level over the next few pullbacks will likely decide whether 2028 brings a serious breakout or more time spent building a base.
Disclaimer: This article is for informational purposes only and should not be considered financial advice. Cryptocurrency markets are highly volatile, and price predictions are not guaranteed. Please do your own research before making any investment decisions.


You May Also Like

Cango Inc. Completes $65M Investment and Secures $10M Convertible Note Financing

Cathie Wood’s ARK Invest Buys $13.7M in Circle Shares While Selling Robinhood Stock

The changing face of elder care in Malaysia — Sayed Mohammad Reza Yamani Sayed Umar



