

Bitcoin Price Prediction: Why Can't BTC Break This $63K Wall?
Bitcoin is running into a tough spot. The coin has struggled to punch through $63,000, and on-chain data shows why this level is such a big deal.
This Bitcoin price prediction breaks down the resistance, the support zones below, and what longer-term charts suggest about where BTC may be headed in 2026.
Why is $63,000 such a strong resistance level for $BTC?
According to data shared by crypto analyst Ali Martinez, roughly 623,000 BTC were previously transacted around the $63,000 level, making it one of the largest and most significant resistance clusters on the chart.
That matters because a lot of holders bought near this price. When Bitcoin creeps back up to where they bought, many tend to sell just to break even.
Many holders who bought near $63,000 may use a return to their cost basis as an opportunity to exit at break-even, adding selling pressure around this zone.
On top of that, with global uncertainty also rising, some investors may decide to reduce risk at current levels.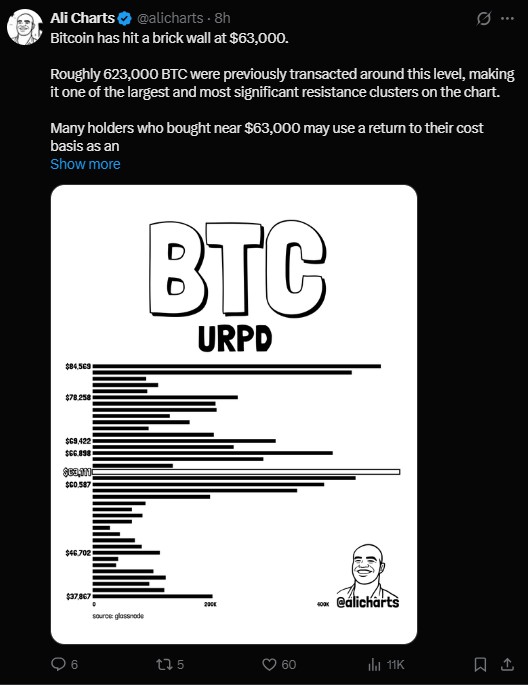
What happens if Bitcoin loses $59,000?
This is the level traders are watching closely right now. If the coin can't clear $63,000 and then slips under $59,000, the chart points to two lower zones.
|
Support Level |
BTC Transacted at Level |
|
$46,000 |
115,000 Coins |
|
$37,870 |
206,000 Coins |
$46,000 saw around 115,000 BTC transacted, while $37,870 saw roughly 206,000 BTC previously change hands. These zones could act as landing spots if the current wall doesn't break.
Where is Bitcoin trading according to MVRV bands?
Martinez also looked at Bitcoin through the MVRV Pricing Bands, a tool used to judge if BTC is cheap or expensive compared to its historical average.
Right now, BTC is positioned between the -0.5 and -1.0 MVRV bands, meaning the market does not present a clear valuation advantage at current prices.
He flagged one number as the real signal to watch. The -1.0 MVRV Pricing Band, now sitting at $49,867, is considered a major buy signal and a prime accumulation zone if the coin falls that far.
That price lines up closely with the $46,000 support zone mentioned above, which makes it a level worth remembering.
$BTC Live Market Snapshot
|
Metric |
Value |
|
BTC Price |
$62,953.30 (+1.37%) |
|
Futures Volume (24h) |
$54.50B |
|
Open Interest |
$46.69B |
|
Market Cap |
$1.26T |
|
Circulating Supply |
20.05M BTC |
|
Max Supply |
21.00M BTC |
|
24h Long Liquidations |
$28.91M |
|
24h Short Liquidations |
$37.76M |
Open interest is up 3.42% even as trading volume dropped 8.54%. That mix often shows traders holding onto positions rather than closing them out, even with lighter activity.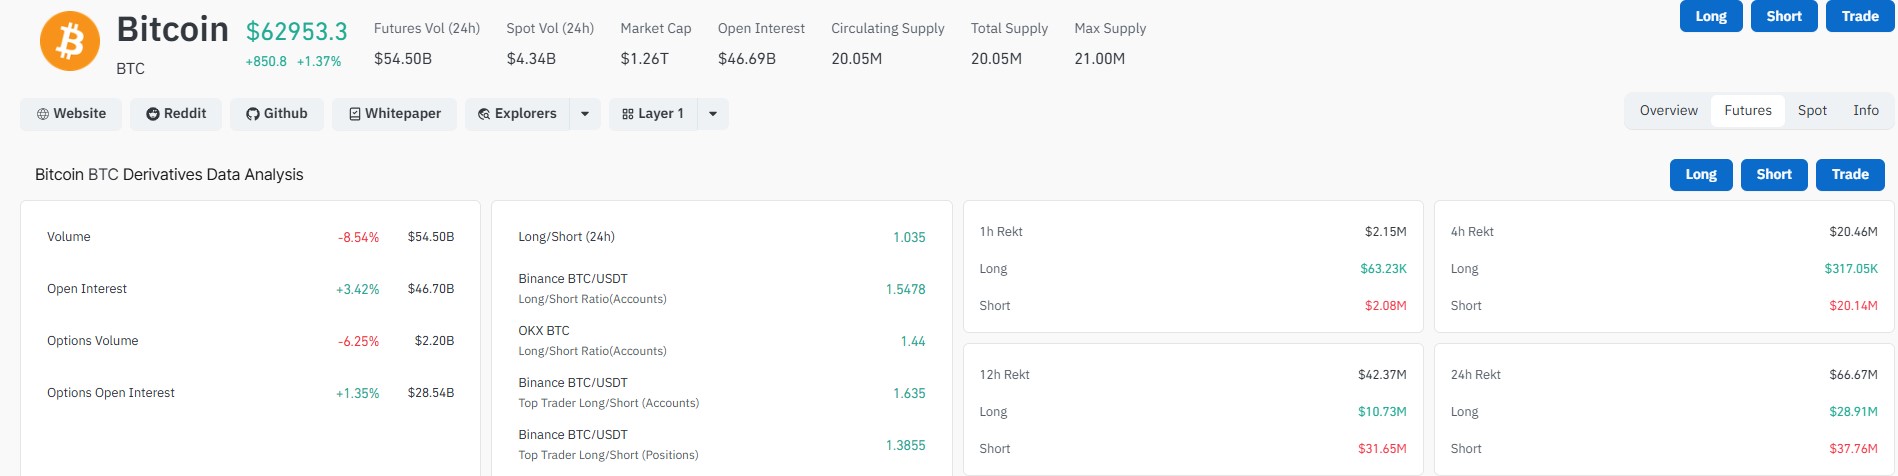
What does the halving cycle chart say about a Bitcoin bottom?
A separate weekly chart from EGRAG Crypto compares how long it takes to go from cycle top to macro bottom after each halving.
Past cycles show a pattern. Cycle one took 399 days, cycle two and three each took 364 days, and the current cycle is tracking near 371 days, a rough average of 375 days.
Based on that timing, the projected bottom window falls somewhere in September or October 2026.
The world's largest cryptocurrency is currently sitting inside what the chart calls a bear-market compression zone, a phase that has marked the final leg down before past bull runs began.
The key thing to watch going forward is whether Bitcoin can reclaim its longer-term trend structure.
If it does, a new bull phase could start building. If not, the current slow grind could continue toward that projected bottom window.
Are ETF flows adding pressure on Bitcoin right now?
Institutional money has been leaning slightly negative. Yesterday saw a net outflow of $84.86 million from BTC ETFs, adding a bit more weight to the cautious mood around current price action.
It's not a massive number, but combined with the resistance at $63,000, it shows institutions aren't rushing back in just yet.
Bottom line for Bitcoin traders
Bitcoin price prediction sits at a crossroads. $63,000 is the wall bulls need to break, and $59,000 is the floor bears want to crack.
Whether this turns into a slow bottoming process stretching into late 2026, or a quicker move past resistance, likely depends on how these next few weeks play out.
Nothing here is guaranteed either way, and the charts only tell part of the story.
Disclaimer
This article is for informational purposes only and should not be considered financial or investment advice. Cryptocurrency markets are highly volatile and carry significant risk. Always do your own research and consult a licensed financial advisor before making any investment decisions.


You May Also Like

Avalanche News Today: HalfMoon DEX Live and AI Payment Network Expands

Franklin Templeton Just Confirmed XRP for Wall Street

Cash Cat Explodes, Then Crashes: What Happened?



