

Ethereum price holds $1,750 as Middle East tensions and $1,800 wall cap recovery
Ethereum price has remained pinned near $1,750 after renewed Middle East tensions triggered a risk-off mood across financial markets and sellers once again defended the $1,800 resistance zone.
- Ethereum price remains stuck near $1,750 as Middle East tensions keep risk appetite subdued across crypto markets.
- Repeated rejection at $1,800 and heavy liquidation clusters continue to block a sustained ETH breakout.
- A break below $1,750 could expose $1,700, while reclaiming $1,800 may trigger a short squeeze toward $2,000.
According to data from crypto.news, Ethereum (ETH) price traded around $1,756 on Wednesday after failing to sustain multiple attempts above $1,800 during the past week. The latest rejection followed U.S. airstrikes on Iranian military targets after Iran reportedly fired on civilian shipping near the Strait of Hormuz, sending investors toward traditional safe-haven assets and limiting demand for cryptocurrencies.
The conflict also disrupted diplomatic efforts that had already paused during Iran’s official mourning period for Supreme Leader Ali Khamenei.
At the same time, regulatory uncertainty in the U.S. has discouraged fresh institutional positioning. The Securities and Exchange Commission updated its 2026 rulemaking agenda on July 7 and July 8 with three cryptocurrency proposals covering safe harbors, broker-dealer capital requirements, and alternative trading systems.
While the framework offers more regulatory clarity than enforcement-led oversight, major investors continue to await the fate of the CLARITY Act before deploying additional capital into digital assets.
Ethereum remains trapped between strong support and heavy resistance
Ethereum’s price structure continues to compress inside a well-defined range. The 4-hour chart shows repeated failures near the $1,850 resistance area, while buyers have repeatedly defended support around $1,750. The latest rejection formed after ETH completed another rounded recovery pattern but stalled below horizontal resistance, extending a trading range that has dominated price action for several sessions.
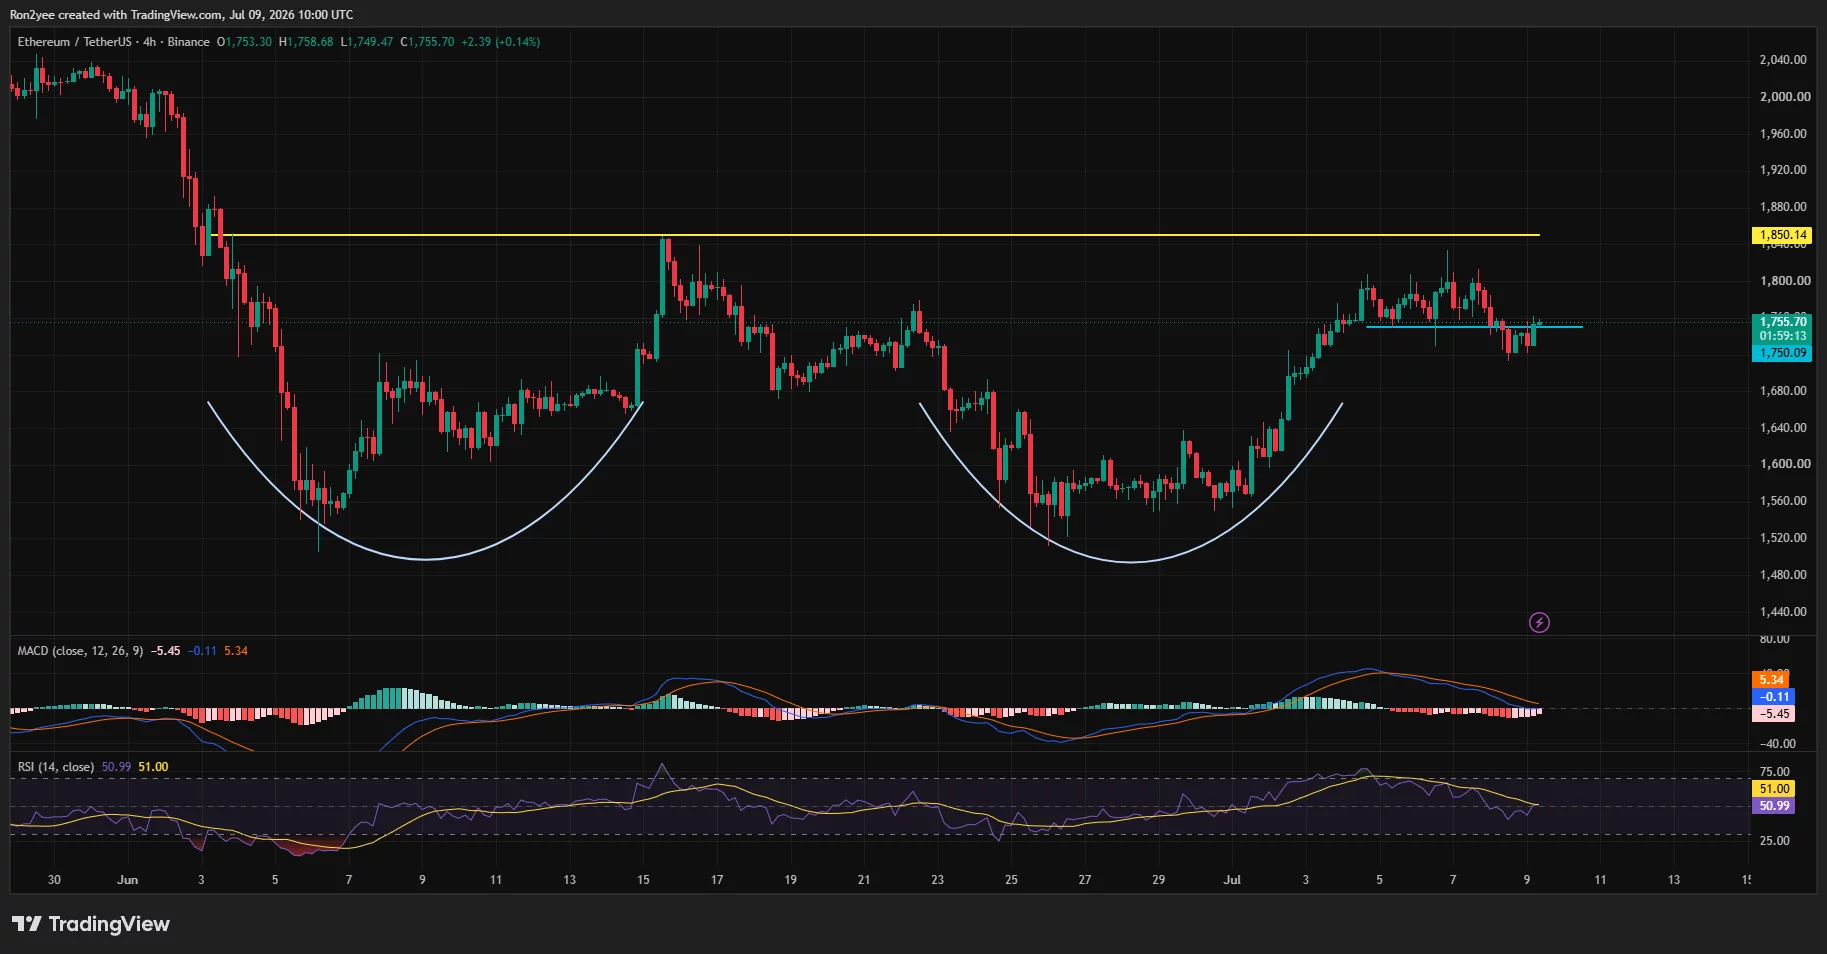
According to crypto analyst Daan Crypto Trades, “ETH Rejected at $1800 for the fourth time this last week. This resistance has held every single attempt so far… Below, this $1750 region remains key.” His chart identifies $1,750 as the lower boundary of the current range, with a decisive move beyond either level likely to determine Ethereum’s next directional trend.
Daily technical indicators present a mixed picture. Ethereum has reclaimed a descending trendline that capped prices since May and continues to trade above the 78.6% Fibonacci retracement level near $1,703.
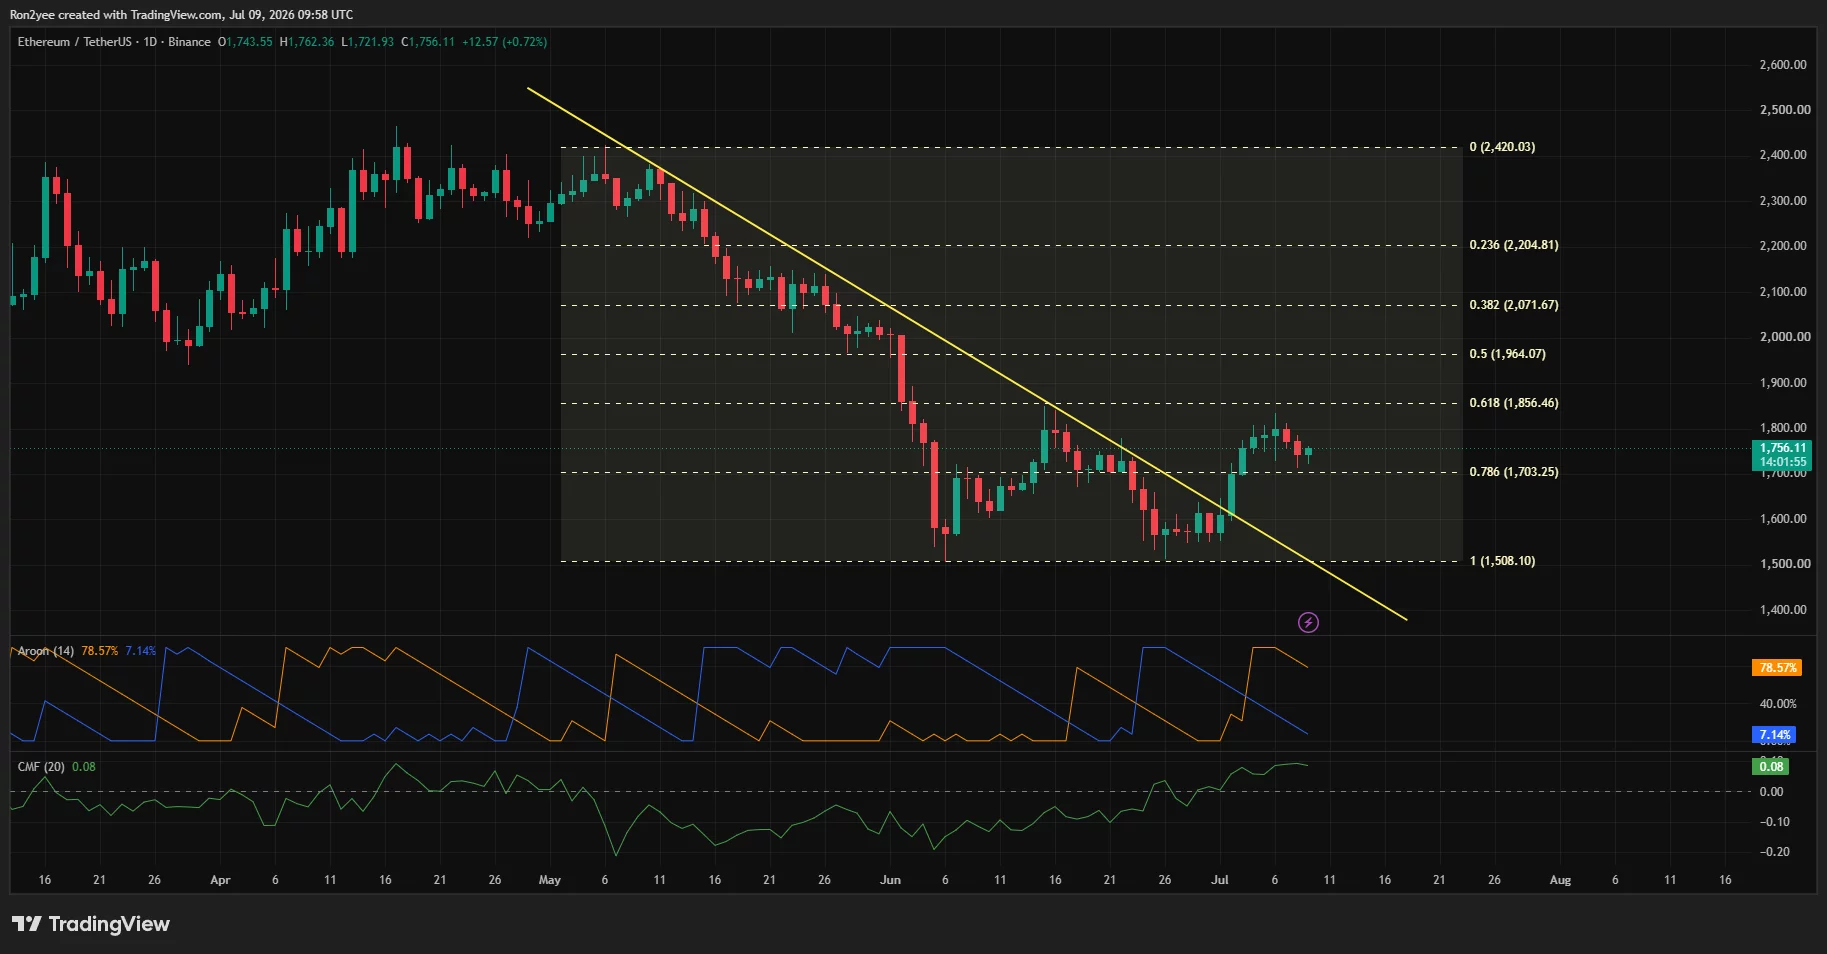
Chaikin Money Flow remains positive at 0.08, suggesting capital continues to enter the market, while the Aroon Up reading remains dominant. Momentum, however, has slowed as the 4-hour MACD histogram turned negative and the RSI eased toward the neutral 50 level after briefly approaching overbought territory earlier this month.
Derivatives positioning also argues for continued volatility rather than an immediate breakout. CoinGlass liquidation data shows one of the largest short liquidation clusters sitting between roughly $1,770 and $1,780, with even larger concentrations extending toward the $1,800-$1,850 region. A sustained move through those levels could trigger cascading liquidations and accelerate upside momentum.
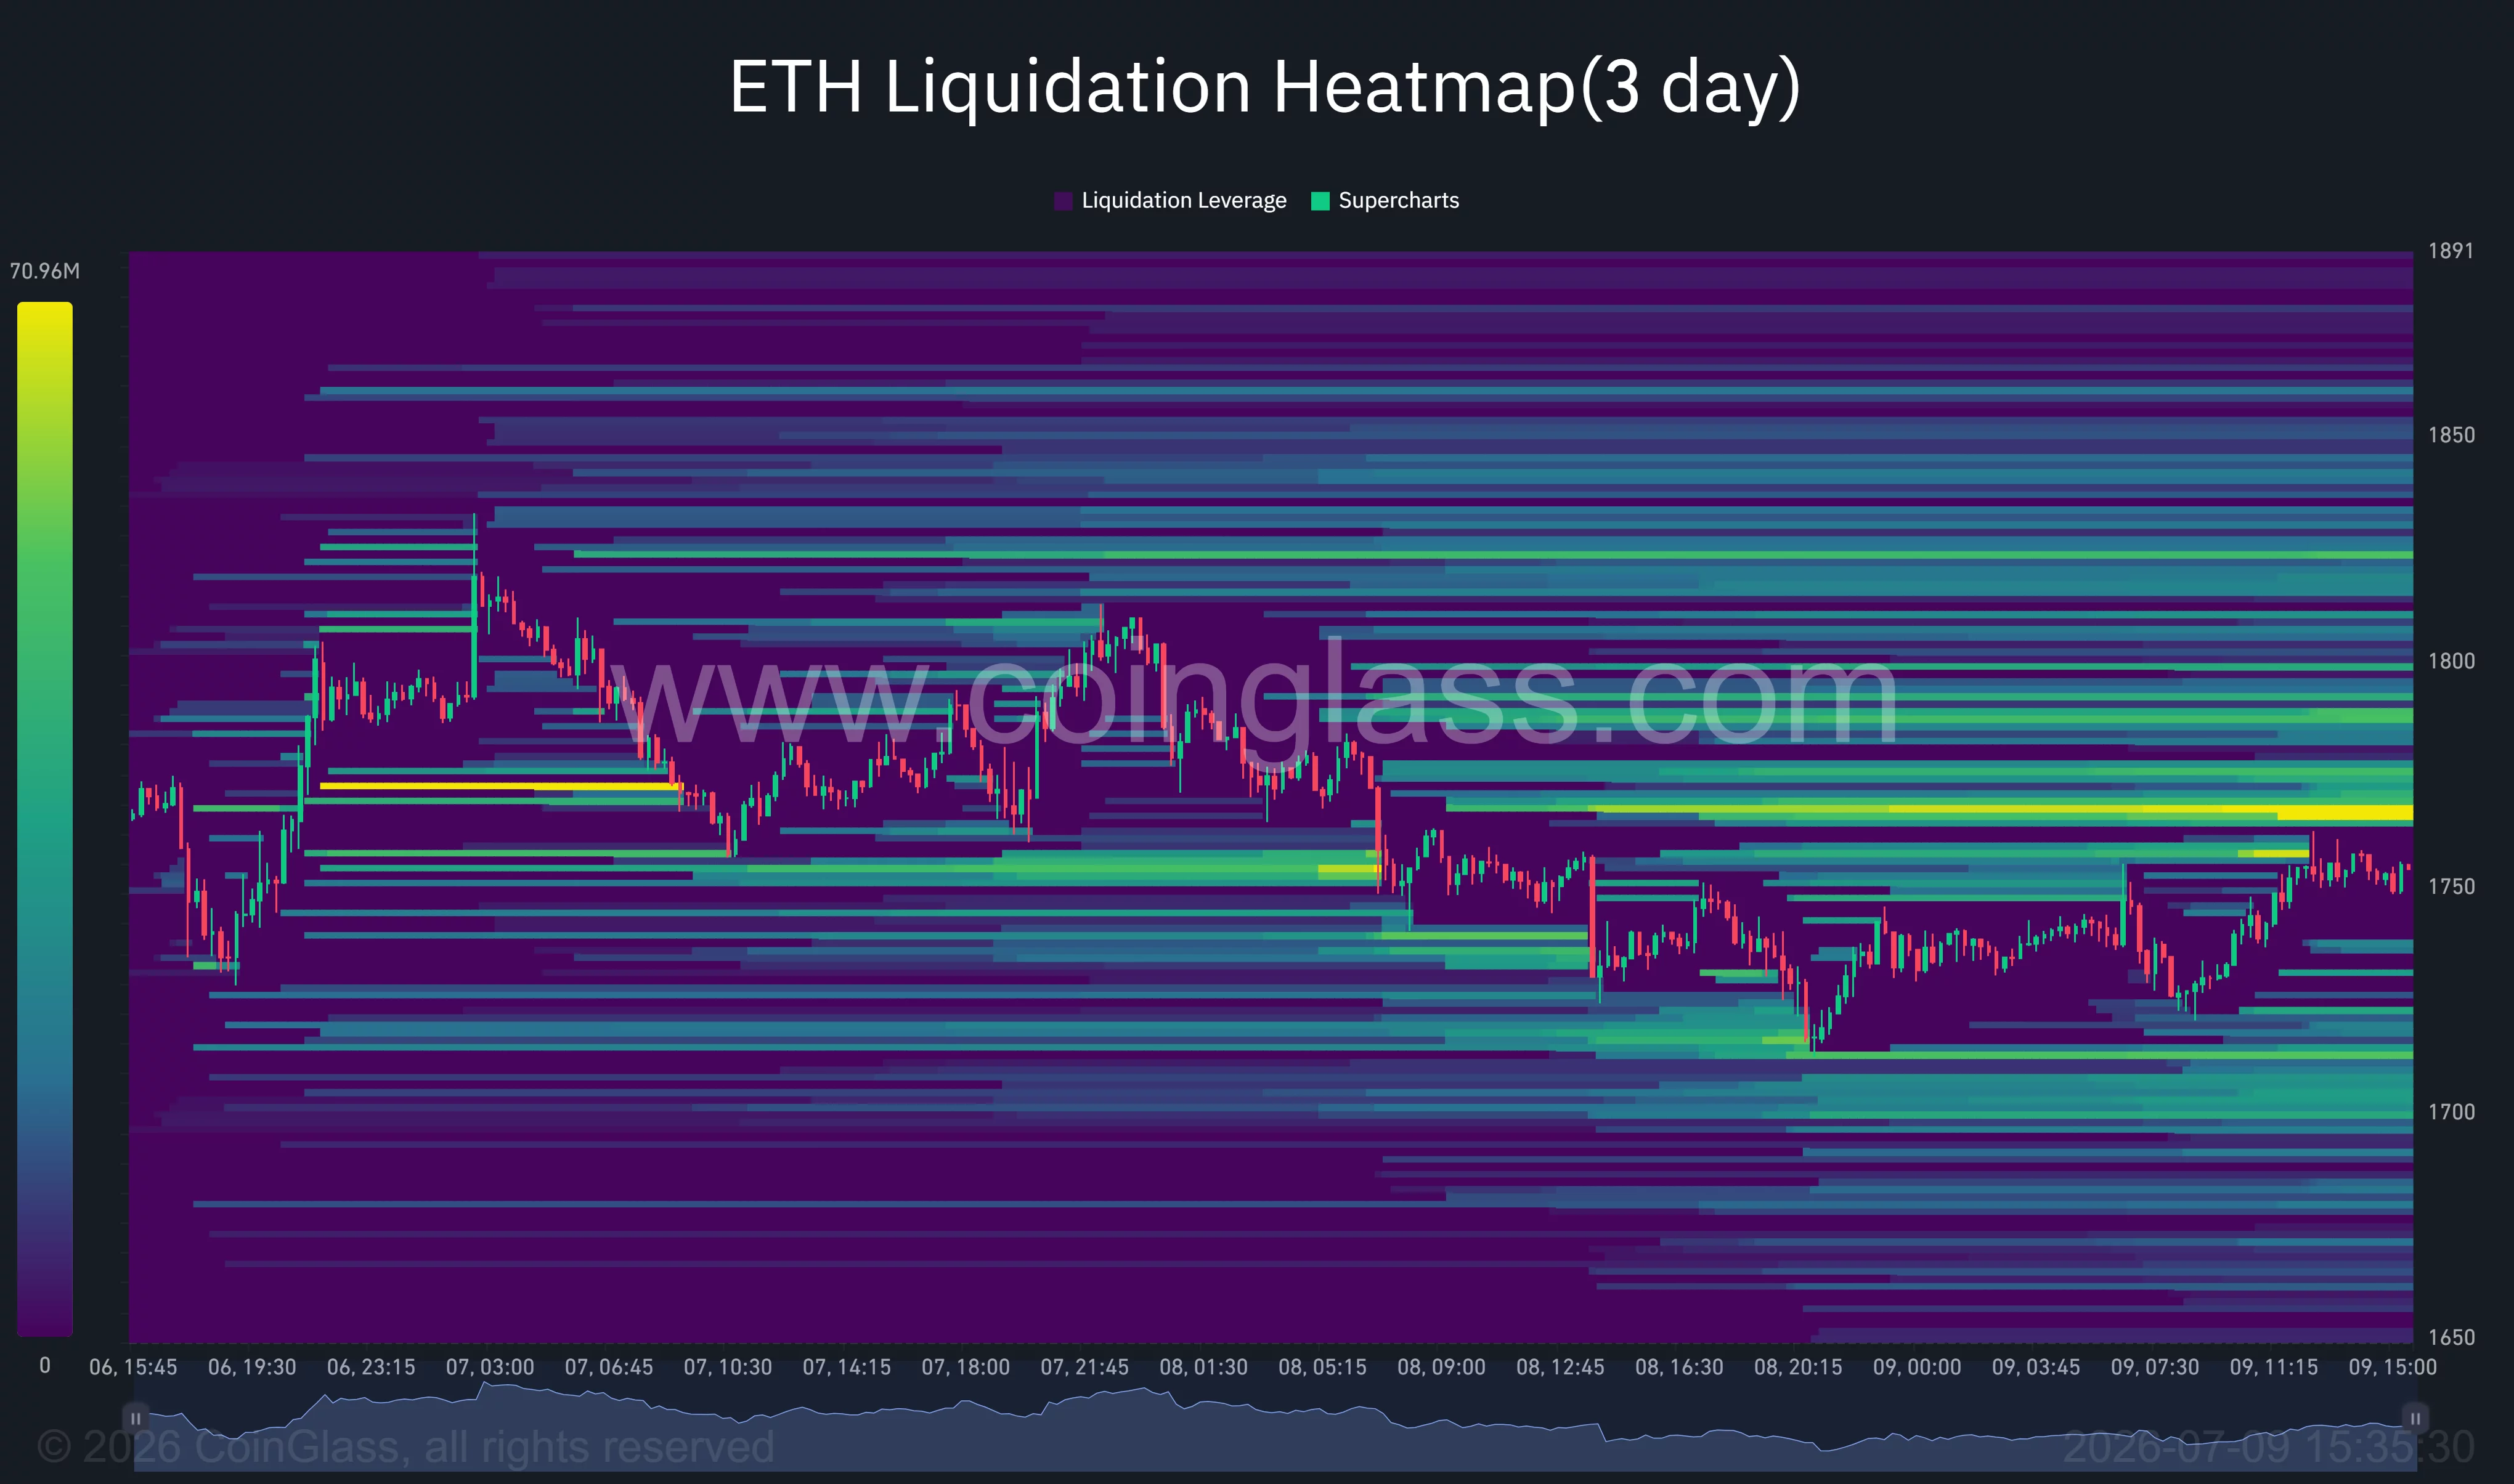
On the downside, notable long liquidation pools have developed around $1,720 and near the psychological $1,700 level, leaving both directions vulnerable to sharp moves if either boundary gives way.
Beyond price action, Ethereum continues to face structural headwinds inside its own ecosystem. Activity has increasingly migrated toward layer-2 networks and competing layer-1 blockchains, reducing activity on Ethereum’s mainnet. Lower transaction fees have weakened ETH’s burn rate while decentralized finance activity remains below previous cycle highs.
Even Vitalik Buterin’s newly released Lean Ethereum roadmap, which outlines upgrades for scalability, privacy and quantum resistance through 2029, has so far failed to generate a meaningful market response.
A break below $1,750 could reopen the path toward $1,700
The bullish case remains intact as long as Ethereum holds above its current support band. Commenting on the market, analyst Ted Pillows argued:
His chart identifies the next upside objective near $2,000 if buyers reclaim momentum.
A close below $1,750 would weaken that outlook. Such a move could expose the $1,720 liquidity pocket before opening the door toward $1,700 and the nearby 200-day moving average around $1,694.
Additional geopolitical escalation, higher oil prices, delays to U.S. crypto legislation, or another wave of risk-off selling across global markets could strengthen bearish pressure and postpone Ethereum’s attempt to reclaim the $1,800-$1,850 resistance zone.
Disclosure: This article does not represent investment advice. The content and materials featured on this page are for educational purposes only.


You May Also Like

PMI-ACP Exam Preparation: How to Use a Simulator and Practice Questions Effectively

The Chemistry of UV Resistance: How Titanium Dioxide Protects Against the California Sun

Robotics Automation Prototyping: Engineering Kinetic Agility into End-Effectors



