

XRP Price Holds Near Key Support as Analysts Debate a Slip or Double Bottom
Key Insights:
- XRP price trades near $1.10 after losing the upper Gaussian Channel band around $1.35.
- ChartNerd identified $1.04 as a possible cyclical support level based on earlier three-year patterns.
- XRP crypto must reclaim $1.35–$1.40 before the wider bullish structure can improve.
At press tine, XRP price was trading near $1.10. Its latest decline pushed the price toward a cluster of long-term technical support levels. The current structure presents two main possibilities. That includes a deeper slide toward the lower support region or the formation of a wider market bottom.
Several charts place the most important support between approximately $0.80 and $1.04. Longer-term projections point to substantial upside. However, XRP must stabilize and reclaim nearby resistance before those targets become technically relevant.
XRP Price Tests a Possible Macro Cycle Bottom
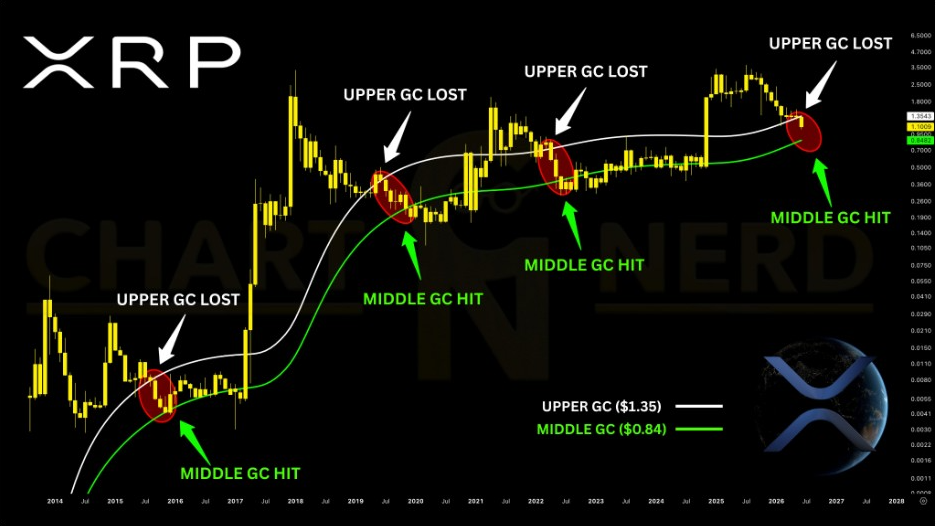
ChartNerd said the XRP price’s two-week Gaussian Channel has produced a macro bullish signal. This happened after the price moved toward the lower regression area. His chart compared the current structure with cyclical lows recorded in 2017, 2020, and 2023.
 2W Gaussian Channel Chart | Source: ChartNerd, X
During each previous cycle, XRP first lost the upper regression band before declining toward the lower Gaussian Channel. Those lower-band tests appeared close to major bear-market turning points.
The latest point of control sits near $1.04, placing XRP price close to a level that could influence its next larger move. Price currently trades around $1.10 after falling roughly 1.4% during the latest session.
The previous signals appeared about three years apart, but that timing does not guarantee another identical outcome. Instead, the comparison identifies a recurring area where selling pressure has previously begun to weaken.
Holding above $1.04 would support the possibility of a cyclical bottom. A decisive loss of that level would leave XRP exposed to the next lower technical band.
Lower Gaussian Band Defines XRP Crypto Downside Risk
Meanwhile, ChartNerd’s broader Gaussian Channel chart showed that XRP price has already lost the upper regression level near $1.35. That area previously acted as support but now forms the first major recovery barrier.
 Gaussian Channel Chart | Source: ChartNerd, X
The middle Gaussian Channel sits between approximately $0.84 and $0.95. Earlier market cycles show XRP repeatedly moving from the upper band toward this lower region before establishing a stronger recovery.
This structure means XRP crypto could decline further without fully invalidating the longer-term bullish view. A move toward $0.95 or $0.84 would instead represent a deeper test of the channel’s historical support.
However, the price would need to respond firmly within that zone. Continued weakness below $0.84 would damage the cyclical pattern and expose the market to a longer correction.
On the upside, reclaiming $1.35 would signal that buyers have recovered the lost upper band. Until then, XRP remains under pressure despite the possible macro support signal near $1.04.
Double-Bottom Structure Depends on $0.80 Holding of XRP Price
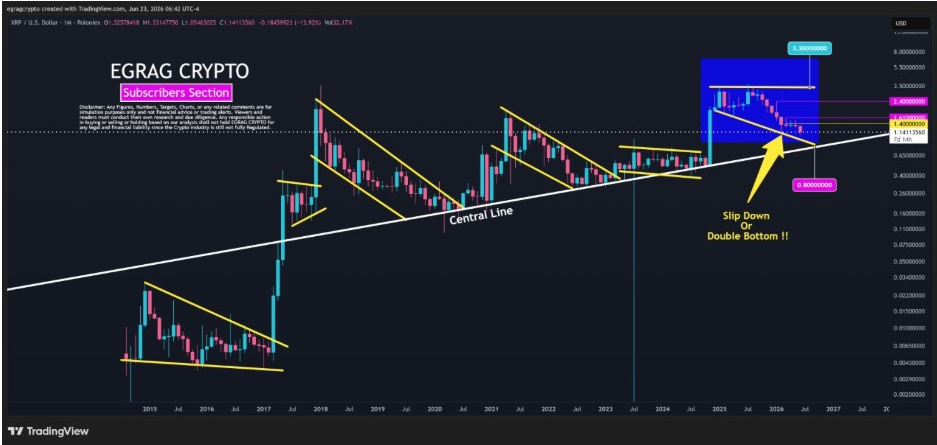
Additionally, EGRAG Crypto sees the current decline as either an extended breakdown or the early formation of a double bottom. His monthly chart showed XRP price approaching a rising central trend line that has supported several major structures.
 XRPUSD Monthly Chart | Source: Egrag Crypto, X
The central line intersects the current formation near the lower end of the market range. Under the bullish scenario, XRP could briefly slip toward $0.80 before finding support and forming a second major low.
That pattern would remain incomplete until price rebounds and clears the resistance between both bottoms. Initial recovery levels appear near $1.40, followed by a larger barrier around $2.40.
A move above $2.40 would improve the broader structure and place the previous high near $3.30 back in focus. The chart, therefore, treats the current decline as a possible construction phase rather than a confirmed reversal.
A monthly close below $0.80 would weaken the double-bottom scenario and break the rising central support line. That outcome would favor continued downside rather than a cyclical recovery.
XRP Crypto Nine-Year Retest Sets the Longer-Term Path
Notably, Maxi Dec2020 viewed the latest weakness as a retest of a large triangle that developed over approximately nine years. His weekly chart connects XRP’s 2018 peak with lower highs while rising support extends from the 2020 bottom.
 XRPUSD Weekly Chart | Source: Maxi, X
XRP broke above the descending boundary during the 2024–2025 advance before later returning toward the breakout area. The current market now sits close to the triangle’s apex between approximately $0.90 and $1.10.
A successful retest would require the price to hold this zone and begin forming higher weekly lows. Reclaiming $1.35–$1.40 would provide the first stronger indication that the former resistance line has turned into support.
The longer-term chart projects a possible move toward $8–$10 after a confirmed recovery. However, XRP crypto must first clear $2.40 and the previous peak near $3.30 before that projection gains stronger technical support.
The post XRP Price Holds Near Key Support as Analysts Debate a Slip or Double Bottom appeared first on The Market Periodical.


You May Also Like

US stocks slide as Trump calls for war escalation

China Nabs Another Huione Group Core Member in Cambodia Extradition

Token Surpasses $1.14 After Stunning 367% Rally


