

Johnson & Johnson Stock Is Near an All-Time High. Does the New Drug Cycle Justify Owning JNJ Above $237?
Key Stats for Johnson & Johnson Stock
- 52-Week Range: $150.73 – $251.71
- Current Price: $237.62
- Street Mean Target: ~$253
- TIKR Model Target: ~$327
- Q1 2026 Revenue: $24.1B (+10% YoY)
- Q1 2026 Adjusted EPS: $2.70 (4th consecutive beat)
- FY2026 Operational Sales Guidance: $99.7B – $100.7B
- Dividend Yield: 2.3% (64 consecutive years of increases)
The launch data inside JNJ stock’s Q1 results is moving faster than Wall Street’s models reflect. Explore JNJ’s financials and new product ramp on TIKR for free →
The Steadiest Large-Cap in Healthcare
Johnson & Johnson (JNJ) is not a stock that tests your conviction with dramatic selloffs. The max drawdown over the past year was just under 11%, hit in late May as Medicaid budget uncertainty and MedTech tariff concerns weighed on healthcare broadly. The stock has already recovered most of that ground and sits near its 52-week high.
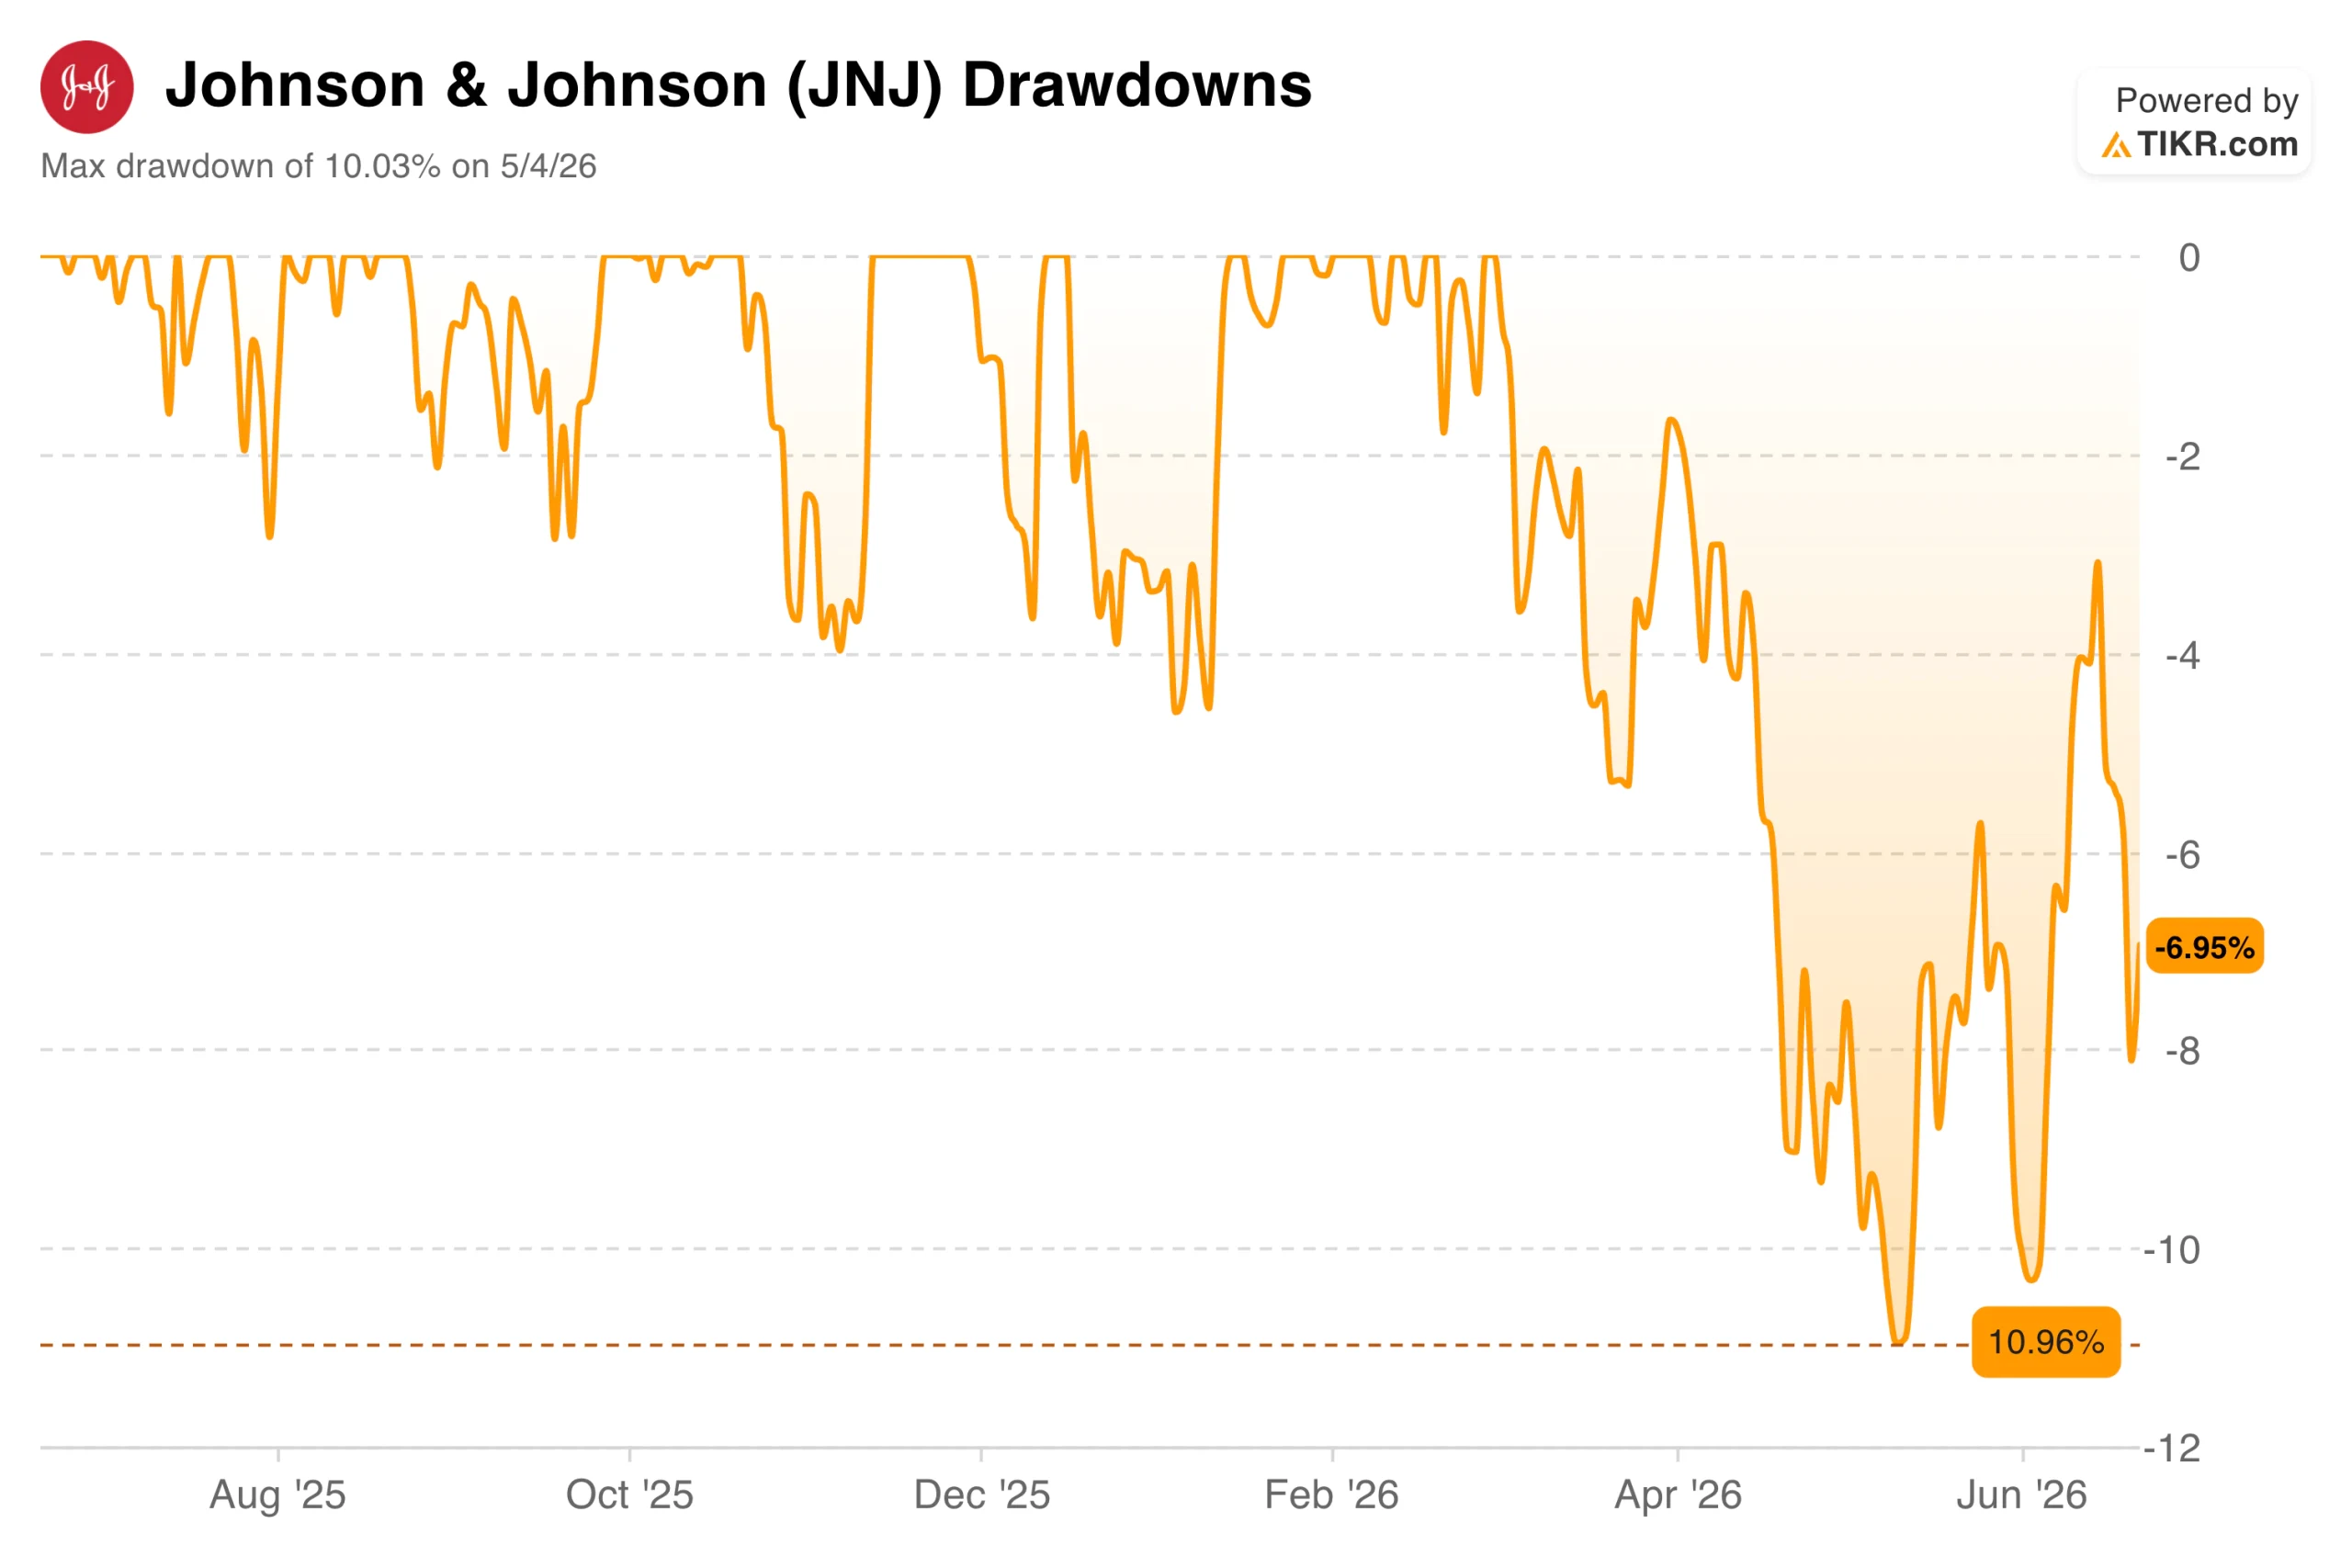 Johnson & Johnson Drawdowns. (TIKR)
That stability reflects the business model. JNJ operates two segments: Innovative Medicine, which sells pharmaceutical products across oncology, immunology, and neuroscience; and MedTech, which covers surgical tools, cardiovascular devices, orthopedics, and vision products.
Together, they generated full-year 2025 sales of roughly $88 billion, and management guided toward full-year 2026 operational sales of between $99.7 and $100.7 billion, the first time the $100 billion threshold has been within reach.
Q1 2026 revenue came in at $24.1 billion, up nearly 10% year over year, with adjusted EPS of $2.70, beating estimates for the fourth consecutive quarter.
See historical and forward estimates for Johnson & Johnson stock (It’s free!) >>>
From Stelara Cliff to New Drug Cycle
The five-year EPS chart tells the story more clearly than any narrative can. Normalized earnings per share were essentially flat from 2021 through 2025, ranging from $9.80 to $10.79, a period during which Stelara biosimilar competition eroded what had been nearly $11 billion in annual revenue while Medicare Part D redesign created additional pricing pressure across the portfolio.
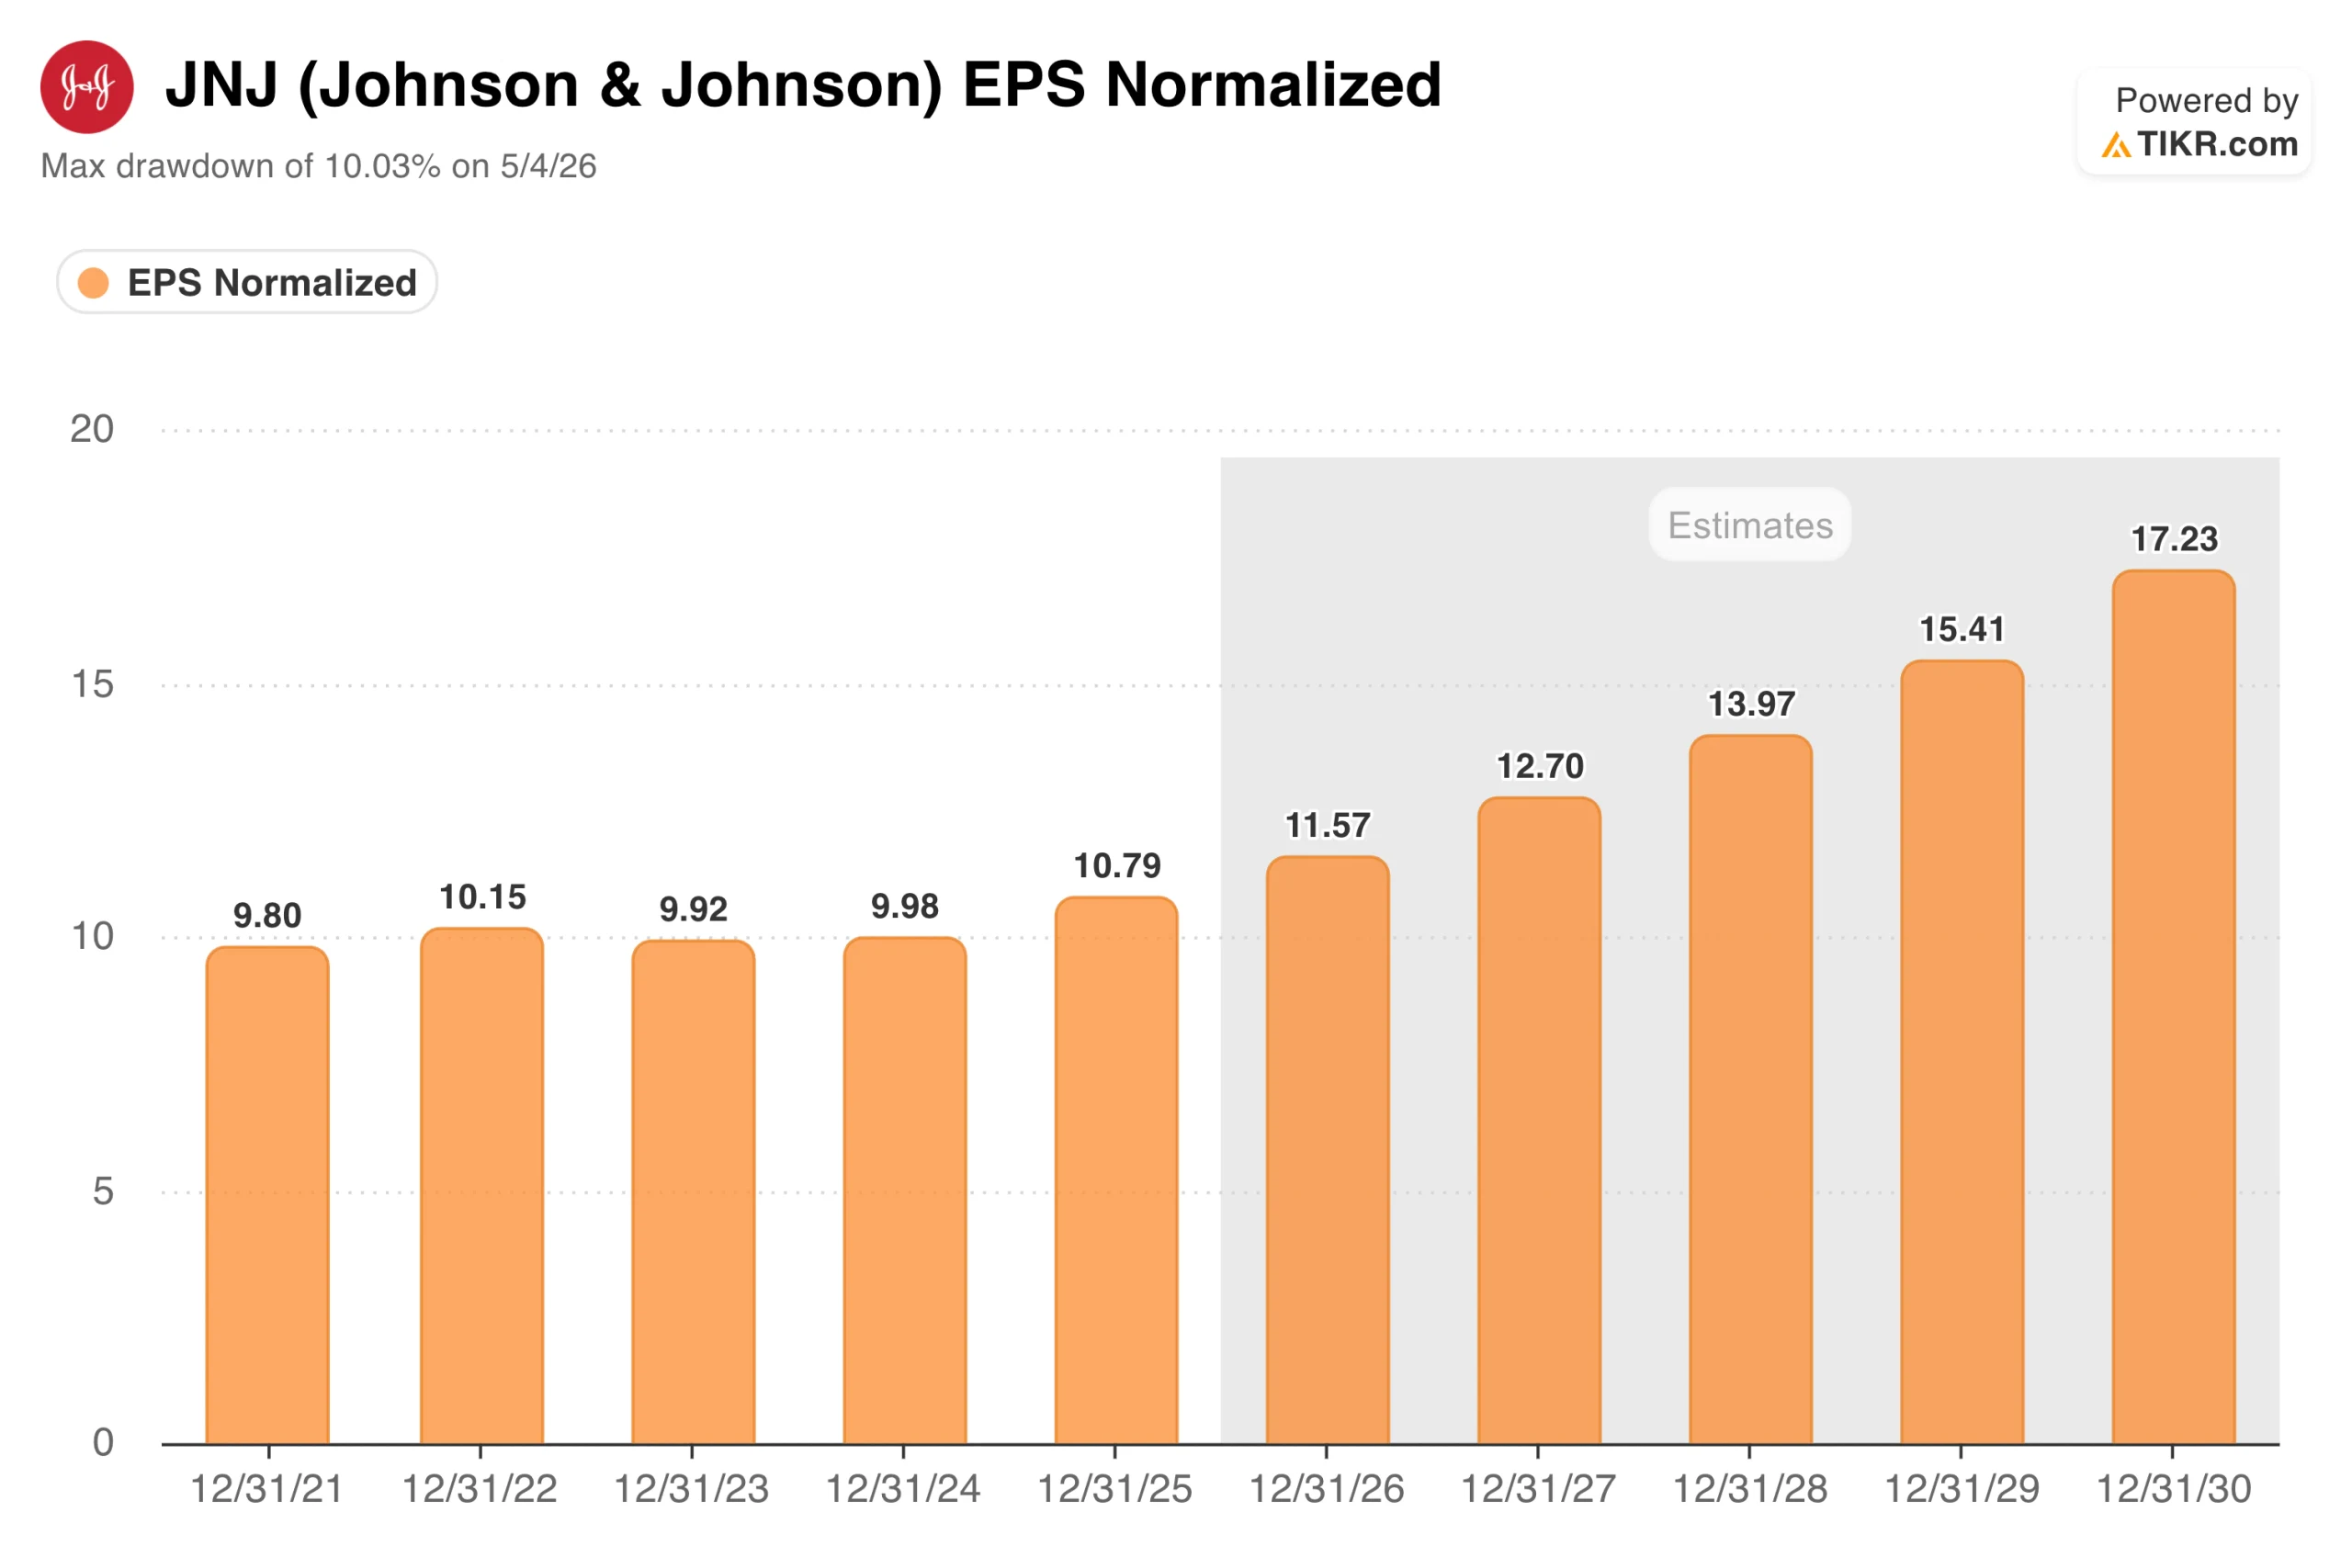 Johnson & Johnson EPS Normalized. (TIKR)
Consensus now projects a meaningful step-change: EPS expanding from around $11.57 in 2026 to approximately $17.23 by 2030, a 60% increase in five years driven by the new drug cycle. Darzalex continues to grow at a double-digit rate. Carvykti, the CAR-T cell therapy for multiple myeloma, is scaling rapidly.
Tremfya received an FDA label expansion in Q2 2026, and Rybrevant, with Lazlozluzumab and Icotyde, is in active Phase 3 studies that could generate significant incremental revenue before the end of the decade.
On the MedTech side, the VARIPULSE Pro electrophysiology system received CE Mark approval in Europe during Q2, and Shockwave’s coronary intravascular lithotripsy platform continues to expand.
The headwinds deserve acknowledgment. Tariffs are expected to have a $500 million impact on MedTech in 2026, and management is monitoring the new Section 122 tariffs as they take effect. Talc litigation remains an active overhang, with a proposed settlement of approximately $9 billion, payable over 25 years, still working its way through the courts.
See how Johnson & Johnson performs against its peers in TIKR (It’s free!) >>>
What Does the Valuation Model Say?
TIKR’s valuation model targets around $327 for Johnson & Johnson stock, with an approximately 8% annualized return through the end of 2030, assuming mid-case revenue growth of around 7% and net income margins expanding toward 32%.
The Street mean target of around $253 reflects a more conservative near-term consensus, while the TIKR model captures the full earnings-compounding trajectory over the decade.
 Johnson & Johnson Valuation Model. (TIKR)
The return scenario is driven by EPS growth of around 9% per year, with modest P/E compression of around 2% annually as the stock matures from recovery rerating to compounder. The scenario range runs from around $369 in the low case at roughly 6% annualized to around $571 in the high case at roughly 11% annualized.
At roughly 20 times forward earnings with a 64th consecutive dividend increase and a 2.3% yield, JNJ is not cheap by historical standards, but the earnings growth trajectory is the strongest it has been in a decade.
Should You Invest in Johnson & Johnson?
Johnson & Johnson is a $557 billion company on track to reach its first $100 billion revenue year, growing earnings at an accelerating rate after five years of stagnation, and raising its dividend without exception for 64 consecutive years.
The remaining questions are about litigation resolution, tariff clarity on MedTech, and whether the new drug cycle can sustain the pace consensus is projecting through 2028.
For investors who prioritize durability, the case is straightforward. This is not a turnaround story. It is a transition that has largely already happened, with the proof now showing up in the numbers.
The TIKR model is built on the assumption that you can interrogate yourself. Run your own valuation on JNJ stock on TIKR for free →
Looking for New Opportunities?
- See what stocks billionaire investors are buying so you can follow the smart money.
- Analyze stocks in as little as 5 minutes with TIKR’s all-in-one, easy-to-use platform.
- The more rocks you overturn… the more opportunities you’ll uncover. Search 100K+ global stocks, global top investor holdings, and more with TIKR.
Disclaimer:
Please note that the articles on TIKR are not intended to serve as investment or financial advice from TIKR or our content team, nor are they recommendations to buy or sell any stocks. We create our content based on TIKR Terminal’s investment data and analysts’ estimates. Our analysis might not include recent company news or important updates. TIKR has no position in any stocks mentioned. Thank you for reading, and happy investing!


You May Also Like

After 'circling the drain' Trump’s DJT stock finally plops in

Black Lake and Nuva Labs Tokenize $25 Million in Institutional Mortgages on Provenance Blockchain

Bitcoin, Gold, and U.S. Stocks Dive as Trump Pledges to Hit Iran ‘Extremely Hard’


