

Solana Price Prediction: SOL Faces a Big Test as Network Activity Reaches New Highs
Key highlights:
- The SOL price is facing an important test between $74 and $77 as buyers attempt to extend the recovery.
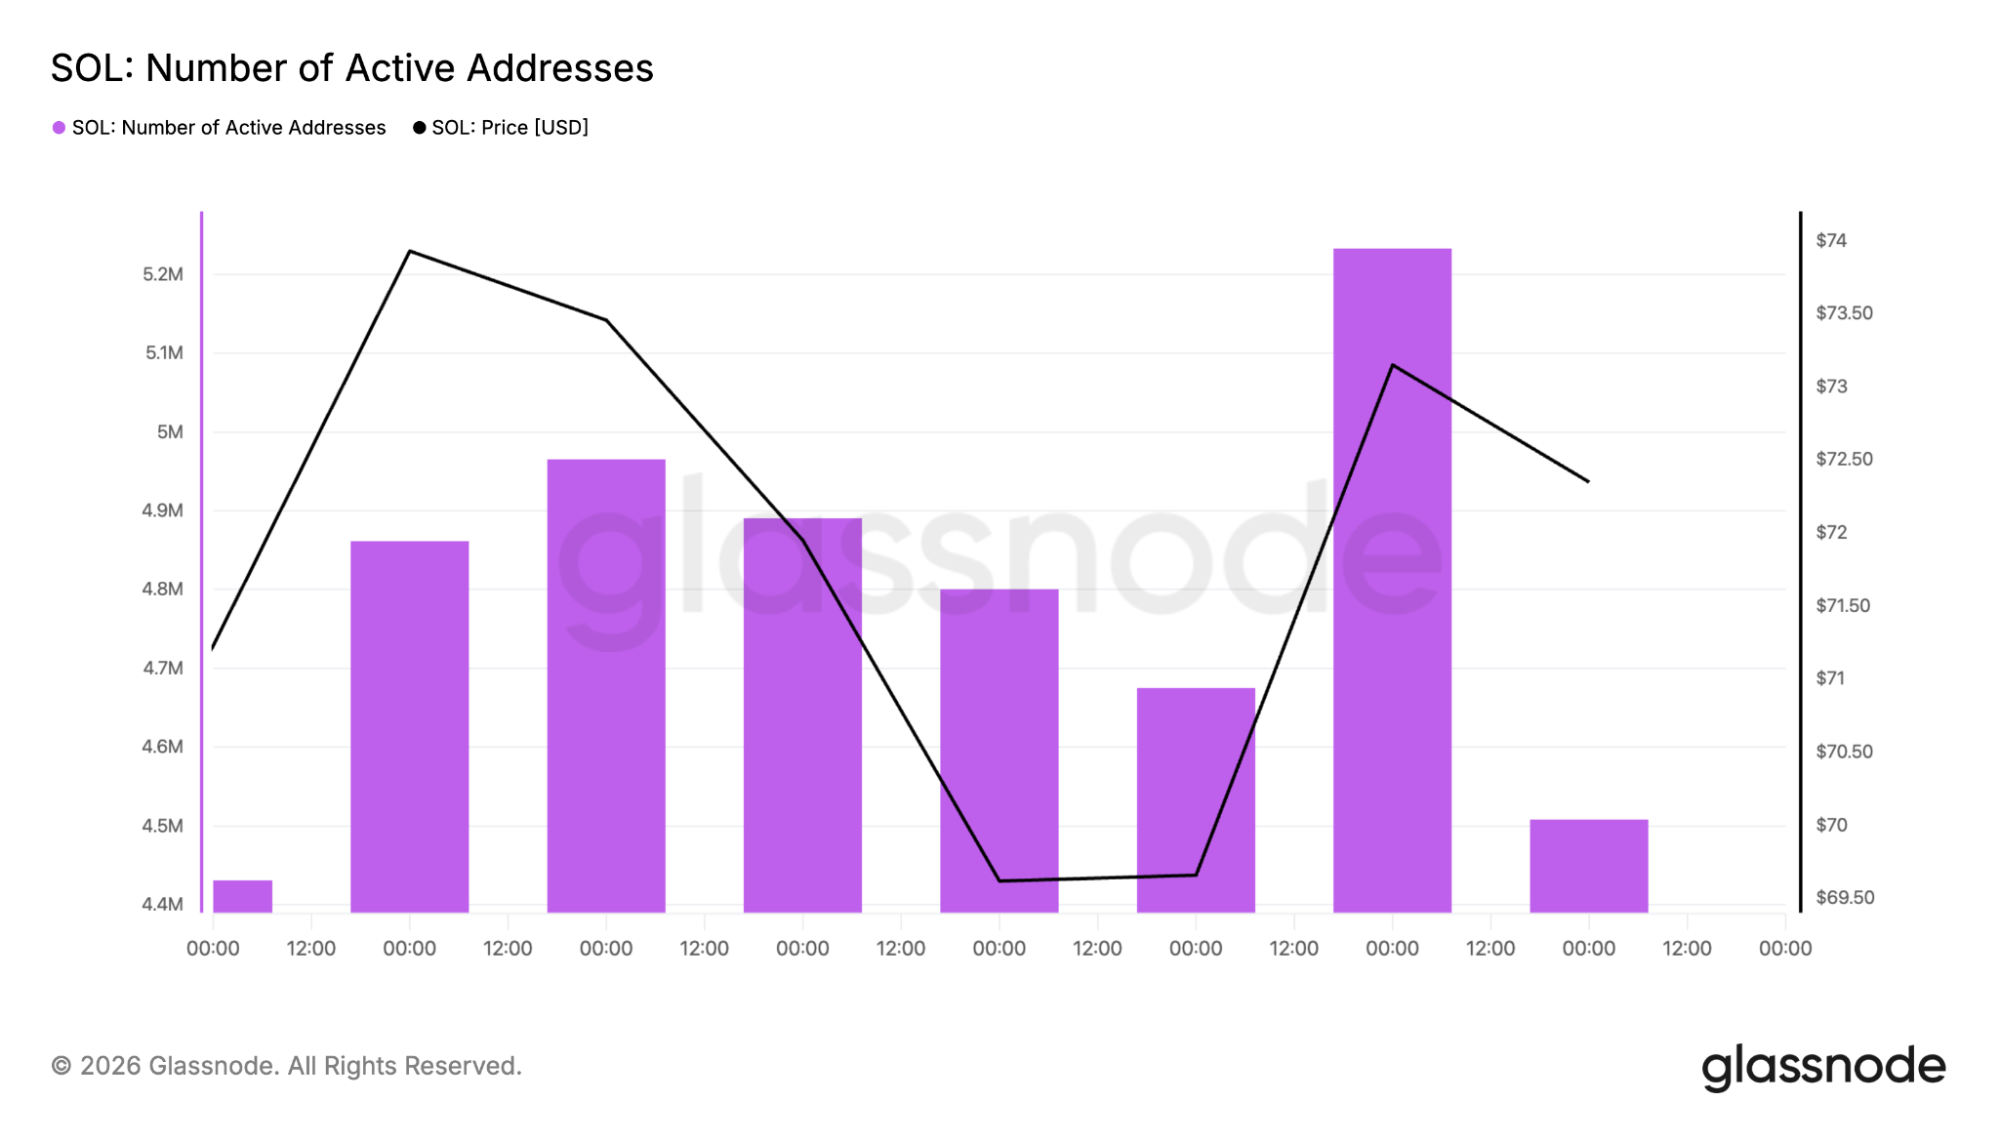
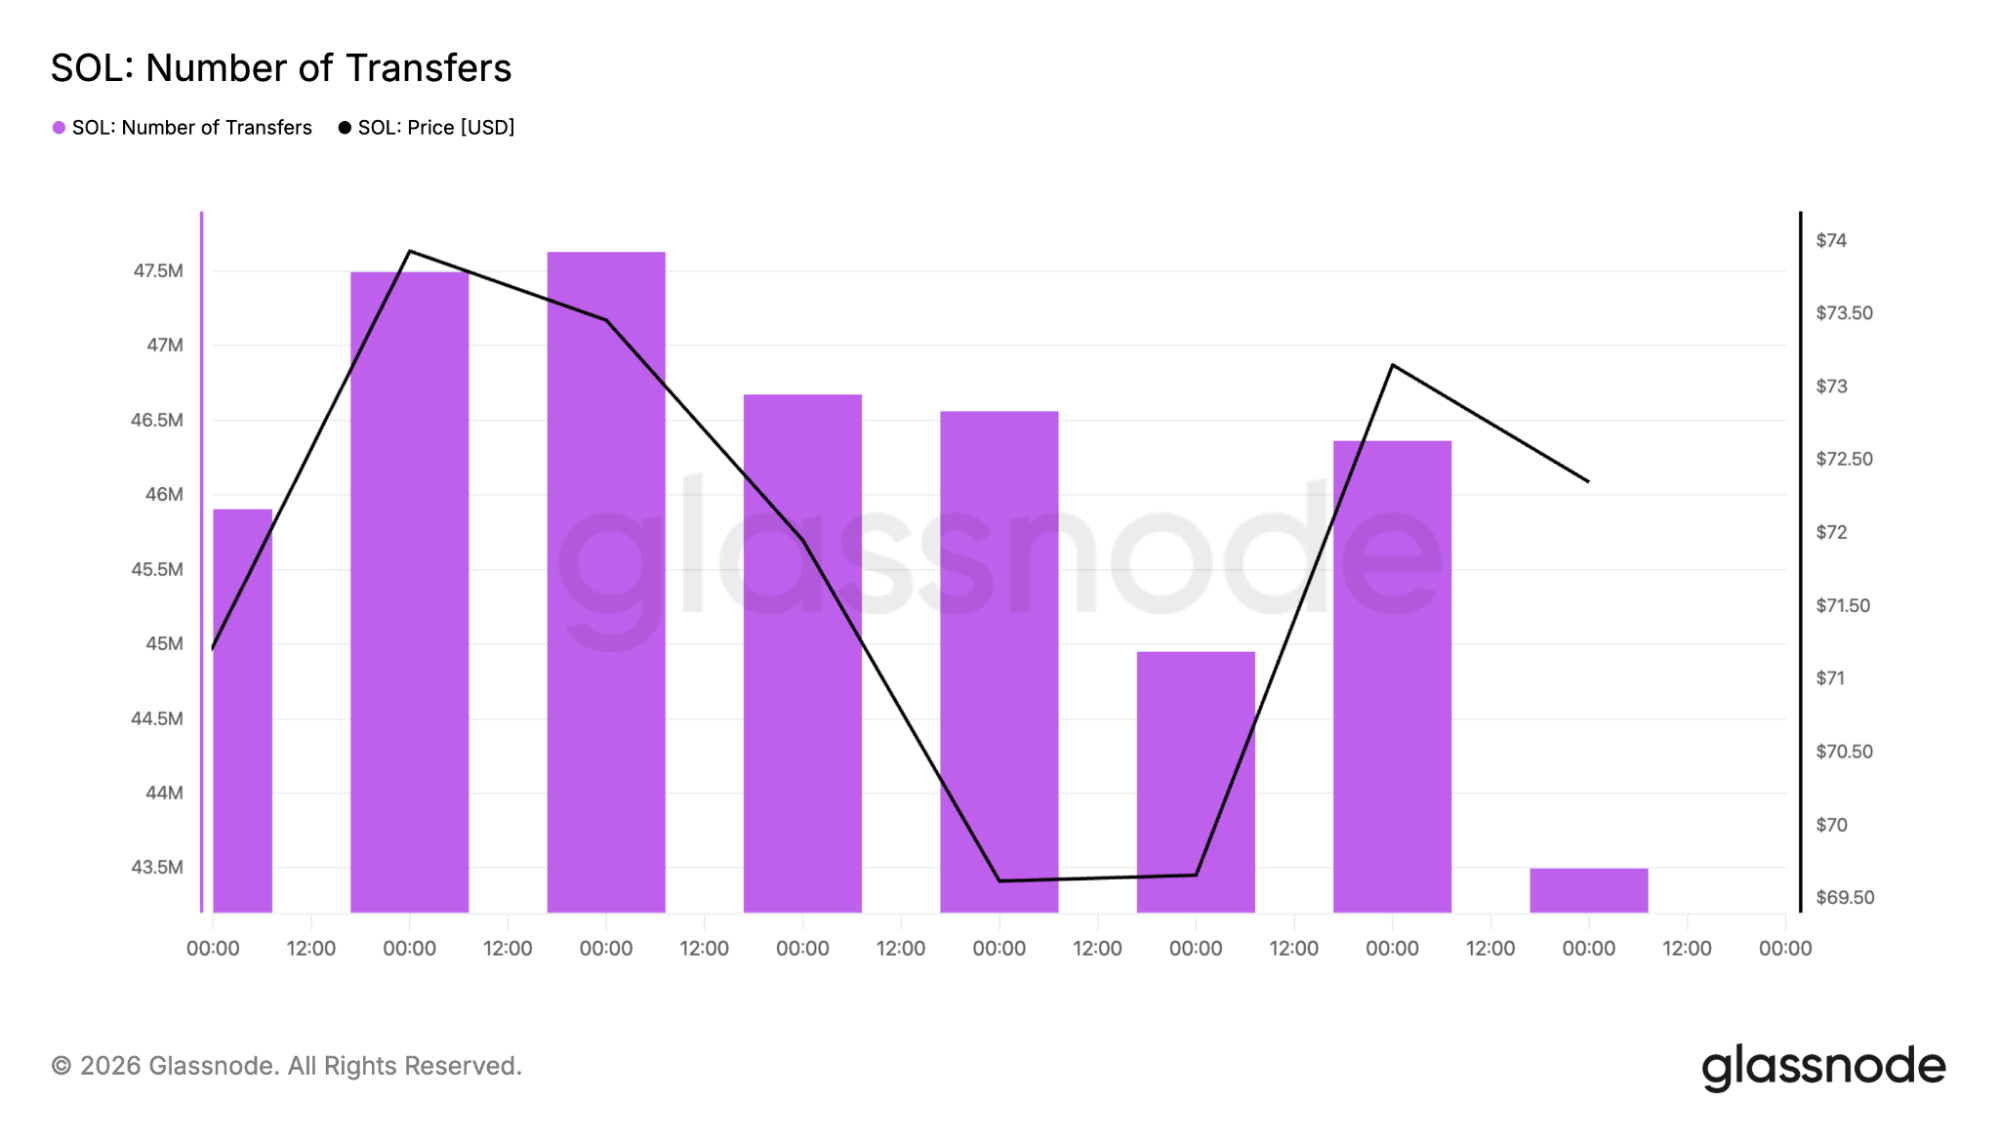
- Network activity on Solana continues to rise, with 46 million active addresses and 75 million daily transfers.
- Alpenglow, Firedancer, and potential SOL ETFs may influence the next phase of price action.
Solana is nearing an important juncture. After bouncing off a low of around $68 seen in June, the SOL price was able to rise back to the mid-$70 level. This development is quite positive, but the next test is not going to be easy. A cluster of resistance levels between $74 and $77 is standing in the way, and traders are watching closely to see if buyers have enough strength to push through.
What makes the situation interesting is that Solana’s network continues to grow at a remarkable pace. Daily active addresses have climbed from roughly 4.4 million to almost 46 million over the measured period, while daily transfers have increased from about 47.5 million to 75 million. Despite those numbers, the SOL price remains far below the highs seen during the previous bull market.
The $75 SOL level is the key battleground
Crypto analyst Ali Martinez recently noted that Solana flashed a TD Sequential buy signal near $68.46 before rallying around 8.4% to a high of $74.27. That move brought the SOL price directly into a major resistance zone.
We had a look at his 4-hour chart, and one thing stands out immediately. The 200-period moving average is acting as a major barrier. In one setup, the 200 SMA is near $74, with the SOL price trading slightly below it around $73.19.
Solana’s network keeps growing
The technical picture is only one part of the story. Under the hood, Solana continues to post impressive usage numbers. Daily active addresses have increased from roughly 4.4 million to nearly 46 million. That represents about a tenfold jump in user activity.
Transaction counts tell a similar story. Daily transfers have climbed from around 47.5 million to 75 million, showing that network usage is expanding across multiple metrics. What stands out is the disconnect between activity and price. The SOL price has spent much of this period moving between roughly $68 and $76, despite the huge increase in users and transactions.
In many cases, strong network growth eventually feeds into price performance. The market has not fully rewarded Solana for that activity yet, which leaves investors debating whether the network is undervalued or whether other market pressures are keeping the token contained.
What the SOL 4-hour and daily charts are showing
There have been some improvements in the SOL price action in the 4-hour chart. At the current value of $74.05, the SOL price is sitting well above the 100-period Simple Moving Average (SMA) of $68.60, making the coin about 5.6% higher than the moving average line. This comes as a positive sign amid the weeks of struggling to improve recovery.
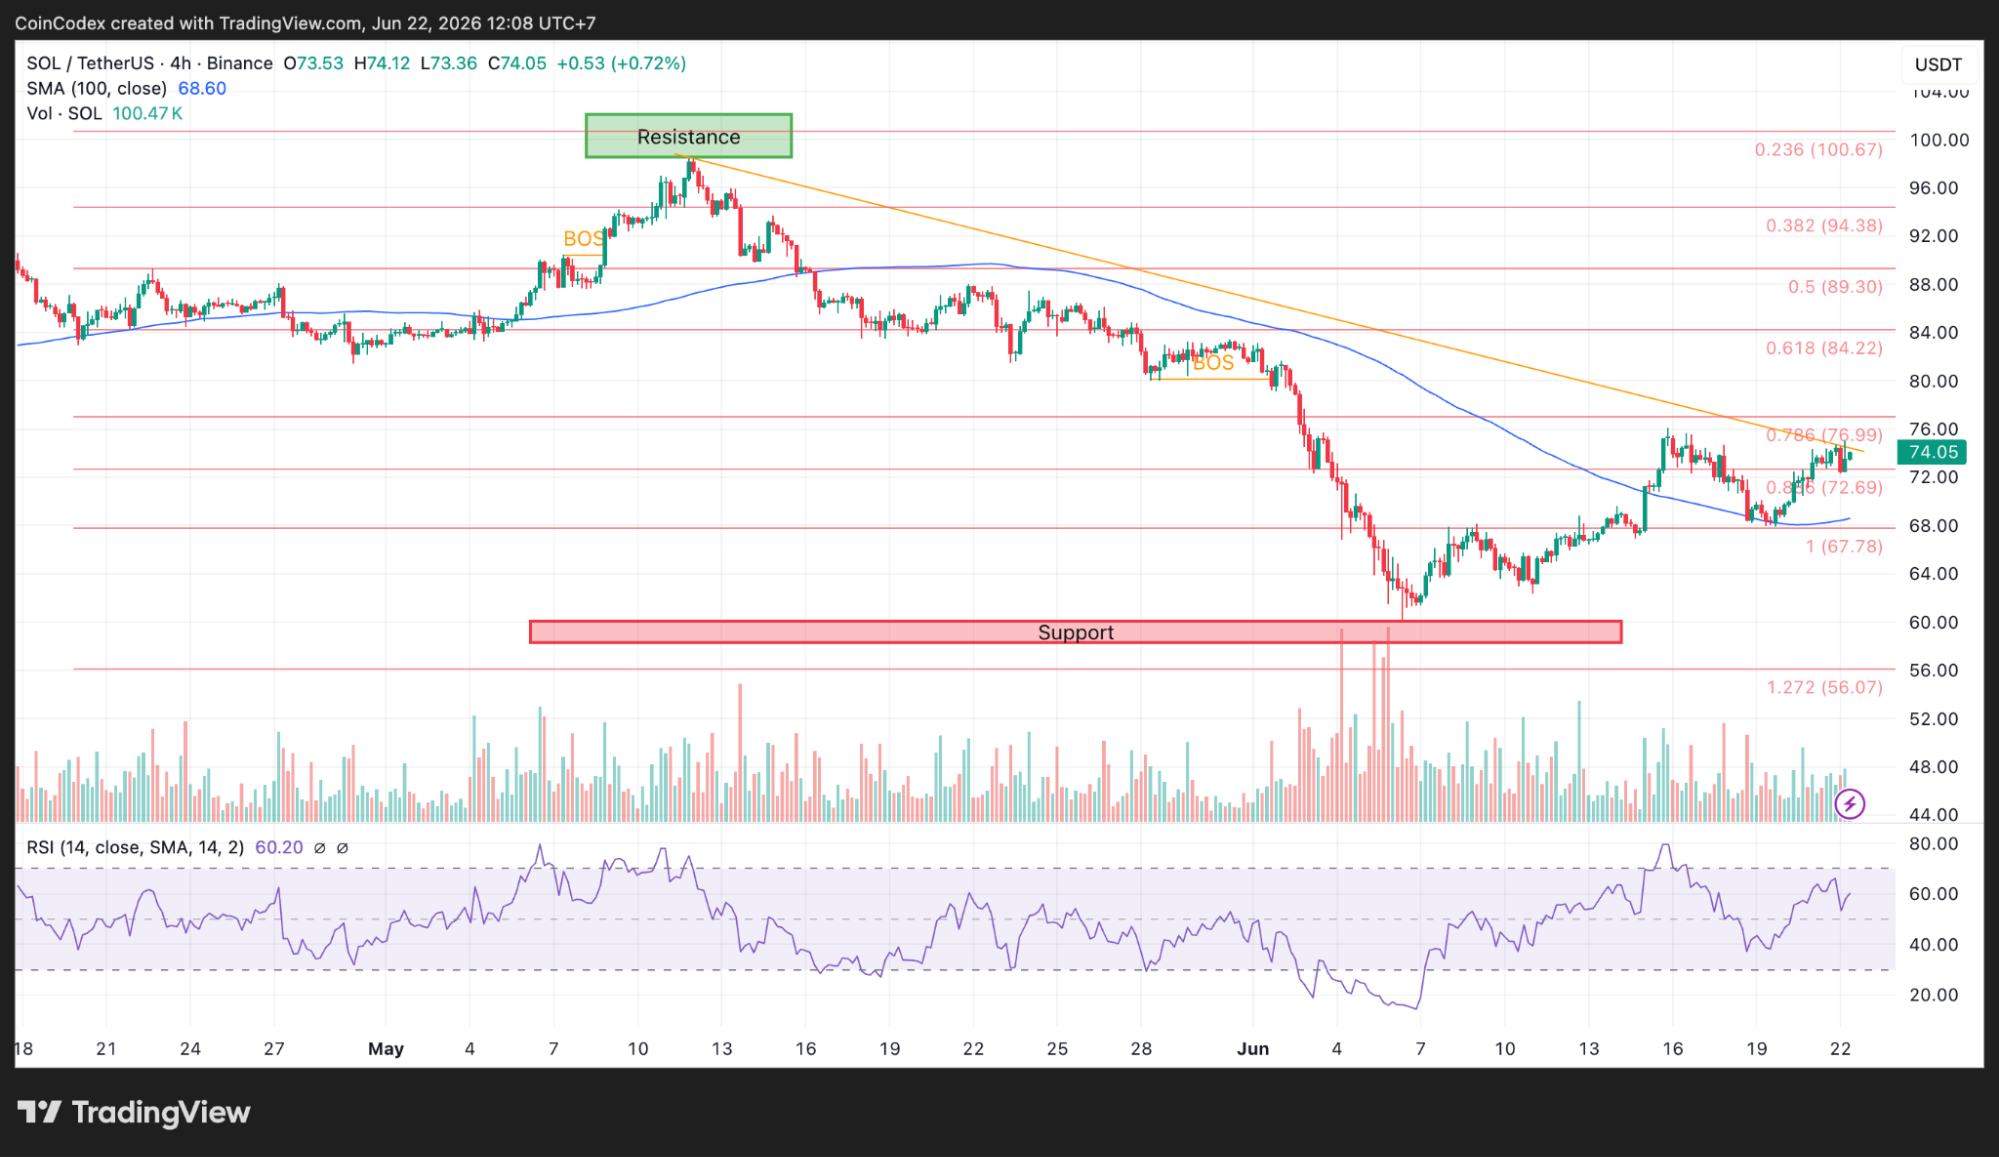
4-hour SOL chart analysis
On the momentum side, the 4-hour Relative Strength Index (RSI) currently stands at 60.20. This indicates an oversold condition since the indicator is above the neutral 50 but still below the overbought range. The next hurdle will be encountered at the 0.786 Fibonacci level of $76.99 with support at $67.78 in case of retracement.
Nevertheless, on the daily chart, it is evident that the SOL price is not out of trouble. The daily value of the price currently stands at $74.11 and is trading about 10.3% below the 100-day Simple Moving Average (SMA) of $82.58. This is because the moving average is declining.
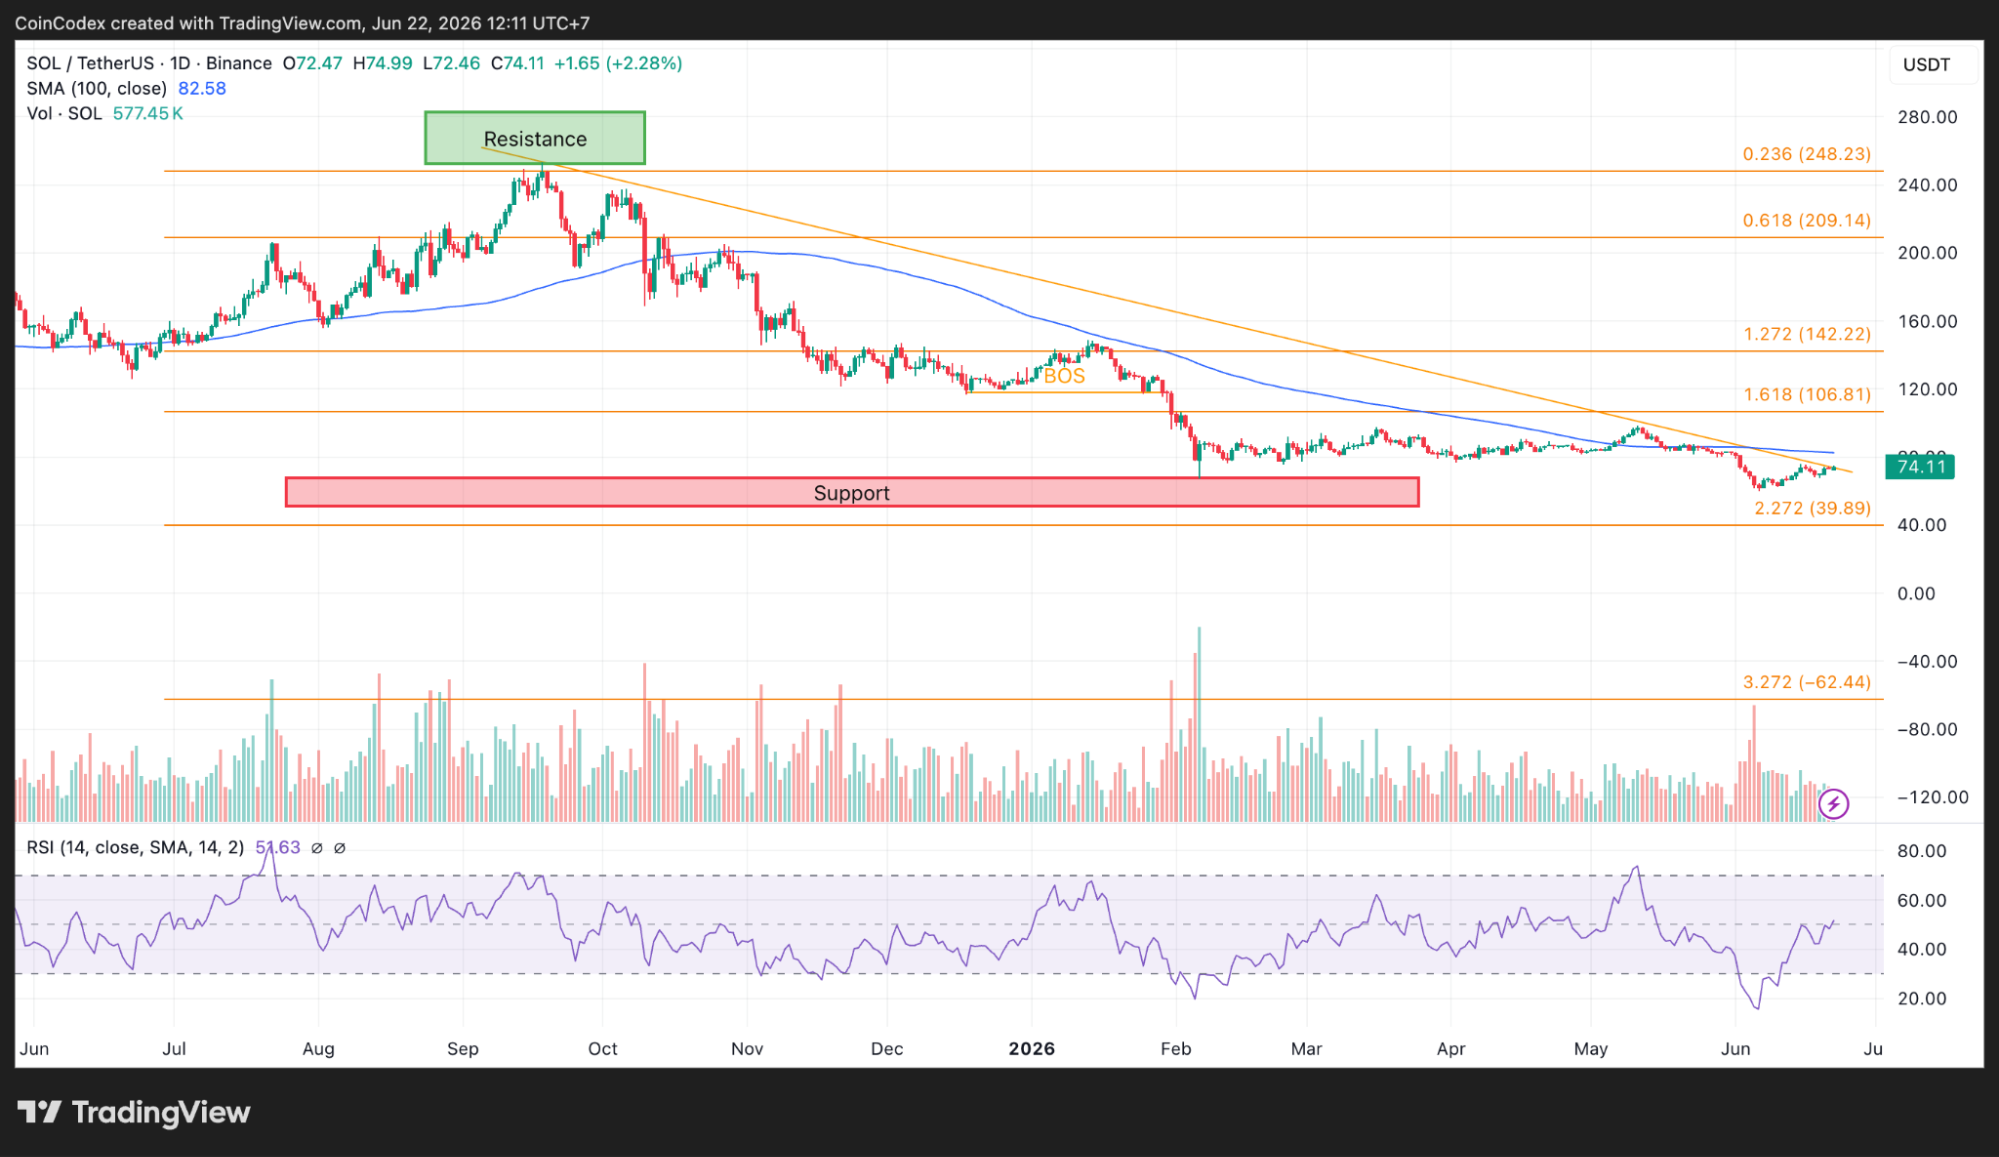
Daily SOL chart analysis
Looking at the bigger picture, Solana is still down roughly 73.5% from its peak near $280. Even so, there are signs of stabilization. The daily RSI has recovered to 51.63 from deeply oversold levels seen earlier in the year, and the SOL price continues to hold near the important $74.11 Fibonacci extension level, giving bulls a level worth defending.
Alpenglow and ETF developments could be a turning point
Beyond short-term trading, Solana’s development roadmap is attracting attention. One of the biggest upgrades in development is Alpenglow, also known as SIMD-0326. The goal is ambitious. Transaction finality could fall from roughly 12 seconds to about 150 milliseconds.
That would make Solana one of the fastest major blockchain networks available. Alongside Alpenglow is Firedancer, an independent validator client designed to improve reliability and strengthen the network by reducing dependence on a single software implementation.
If both upgrades are delivered successfully in 2026, Solana could become even more attractive for payments, trading platforms, gaming applications, and institutional use cases. Faster transaction processing and stronger infrastructure would strengthen the network’s competitive position.
Another factor investors are watching is the possibility of spot Solana ETFs. Major asset managers, including Fidelity and VanEck, have filed products linked to Solana. Many analysts believe the chances of approval have improved as regulatory clarity around digital assets continues to develop.
An approval could create a fresh source of demand for the SOL price. Delays or regulatory setbacks would likely keep uncertainty in the market.
Where could the SOL price go next?
The next move will likely depend on how Solana reacts around the current resistance zone. If buyers can push the SOL price above $76.99, attention would quickly turn toward $80 and then the daily resistance levels around $82 to $84. If resistance holds again, support around $72 becomes important. A break below that level could expose the $70 region, followed by the June low near $68.
For now, the SOL price is caught between improving fundamentals and stubborn resistance. Network activity is growing rapidly, major upgrades are moving closer, and whales continue accumulating. The missing piece is a decisive breakout above the current ceiling.
Until that happens, traders will keep watching the $74 to $77 range. It is the level that could determine Solana’s next major move. According to CoinCodex’s 1-month SOL price prediction, the price could climb toward $97.74, indicating potential upside from current levels if bullish momentum continues and key resistance zones are cleared.


You May Also Like

Covéa Chooses Shift Technology as Strategic Partner for Fraud and Risk Management

VERAXA Biotech to Showcase BiTAC Cancer Platforms at BIO International Convention

Top U.S. economist says Gold reversal is imminent


Trending News
More24/7 Live News
MoreQuick Reads
More
