

XRP Charts Point to a Possible 25% Rally in July
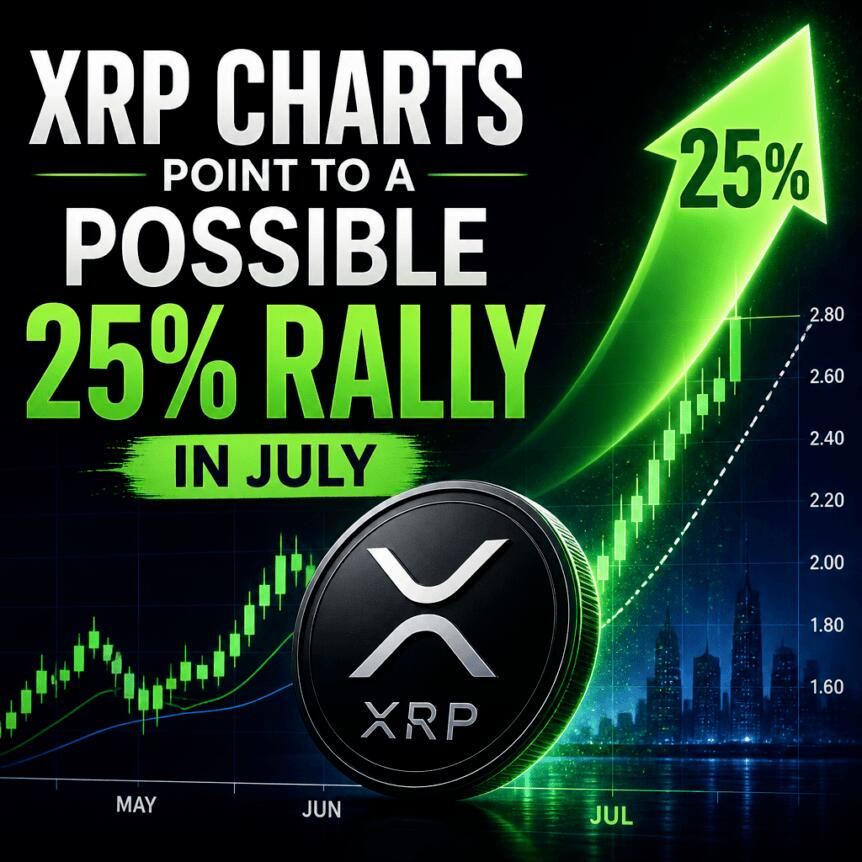
XRP traders are watching a cluster of signals that, if they play out, could set up a short-term relief rally and potentially a larger recovery attempt later in the year. Multiple technical indicators point to a market that may be nearing an oversold phase, with key levels around $1.39–$1.40 attracting attention.
As of Monday, XRP was trading near $1.13, while its longer-term trend gauges and momentum readings suggested the downside move may be losing steam—at least in the near term. At the same time, derivatives positioning data points to a potential “price magnet” effect that could pull the market toward higher liquidation zones.
Key takeaways
- XRP’s 20-week EMA is close to crossing below its 200-week EMA, a weekly “death cross” scenario that has historically been followed by mean-reversion rebounds.
- A move back toward the $1.39–$1.40 zone would align with prior post-cross behavior and could represent roughly the mid-20% upside range from around $1.13.
- CoinGlass liquidation heatmap data for XRP/USDT shows heavier short liquidation liquidity above spot, concentrated around approximately $1.37–$1.40.
- An analyst framework from Cryptollica argues XRP could be approaching conditions similar to previous washed-out phases, with long-term targets framed near $8 if a broader bottom develops.
The “mean-reversion” setup targeting $1.39–$1.40
One of the main triggers behind the bullish short-term outlook is XRP’s positioning relative to two long-horizon moving averages. According to TradingView data referenced in the report, XRP’s 20-week exponential moving average (20-week EMA) was near $1.40 and appeared on the verge of dropping below the 200-week EMA (around $1.39).
If XRP prints a confirmed weekly close below the 200-week EMA, that would mark a relatively uncommon “death cross” between the two trend indicators—an event that traders often associate with sustained weakness. However, the article argues that XRP’s past instances of 20-week/200-week EMA crosses have not led only to further declines; instead, they were followed by relief rebounds back toward the 200-week EMA.
Historically, the cited examples include a roughly 20% recovery in 2019 and a much larger 82.7% rebound in 2022 after similar cross events. Under that same mean-reversion logic, the $1.39–$1.40 band becomes the focal point, implying potential upside on the order of about 23%–25% from XRP’s referenced price near $1.13—timed, in the report’s estimate, toward July.
Momentum data adds another layer. XRP’s weekly relative strength index (RSI) was hovering just above the oversold threshold of 30 on Monday. RSI readings near 30 often indicate that selling pressure may be nearing exhaustion, which can increase the odds of a short-term rebound even if the larger trend remains under pressure.
Derivatives positioning: liquidation liquidity above spot
Beyond charts and momentum, the report also points to derivatives microstructure using CoinGlass data. Specifically, it references a Binance XRP/USDT liquidation heatmap that shows the distribution of liquidation levels above and below the current price.
In that view, there is a heavier concentration of short liquidation liquidity above spot than long liquidation liquidity below it. The largest upside cluster is reported at roughly $236.5 million located in the $1.37–$1.40 zone, according to the CoinGlass liquidation heatmap for XRP/USDT.
Liquidation heatmaps are commonly interpreted as maps of where leveraged positions may be forced to close. If XRP begins rebounding from around $1.13, shorts positioned above the market may face buyback pressure, which can create an accelerant toward nearby liquidation clusters—potentially reinforcing a push toward $1.39–$1.40.
It’s important to note the conditional nature of this mechanism: liquidation “magnets” typically work best when price action already turns upward, because liquidation levels alone do not guarantee direction. Still, the asymmetry highlighted by the heatmap suggests the market’s levered risk may be skewed toward higher prices if a bounce begins.
Longer-term framing: a potential broader bottom toward $8
The story does not stop at near-term levels. A separate long-term chart shared by analyst Cryptollica is used to argue that XRP may be entering another stage consistent with major market washouts.
Cryptollica’s framework, shared in a Sunday post on X (linked in the source), highlights XRP’s 10-day RSI hovering near the low-30s—near the range that has historically appeared around major accumulation phases. The post also makes a broader historical claim that, over “13 years,” XRP has only been this “washed out” three times.
In the same chart-based thesis, Cryptollica also points to XRP trading above the lower boundary of a large ascending channel. This channel is described as a support structure that has connected multiple macro lows since 2017. The lower boundary is shown near $0.75, implying the asset may still need another downside sweep before a larger recovery phase begins.
The report frames that potential sequence as: a retest of the channel support area near $0.75 first, followed by a transition into a broader bull-market phase. In that case, the channel’s upper boundary is cited as placing a long-term target near $8.
Because this portion of the narrative relies on technical pattern interpretation rather than a measurable, real-time indicator with a universally accepted trigger, the $8 target should be treated as conditional. What matters for now is the setup being claimed: oversold momentum near key thresholds and the possibility that XRP could remain supported by the channel structure—even if additional downside occurs before any large reversal.
What to watch next for XRP
Traders monitoring this thesis should focus on whether XRP can maintain an oversold bounce without losing the $1.13 area too aggressively, and whether a weekly close develops that confirms the 20-week/200-week death cross scenario. On the derivatives side, pay attention to whether price moves toward the $1.37–$1.40 liquidation cluster instead of stalling below it; and for longer-horizon investors, keep an eye on whether XRP holds above the ascending channel’s lower boundary near $0.75, since that level is positioned as the next checkpoint before any larger recovery attempt.
This article was originally published as XRP Charts Point to a Possible 25% Rally in July on Crypto Breaking News – your trusted source for crypto news, Bitcoin news, and blockchain updates.


You May Also Like

Covéa Chooses Shift Technology as Strategic Partner for Fraud and Risk Management

VERAXA Biotech to Showcase BiTAC Cancer Platforms at BIO International Convention

Top U.S. economist says Gold reversal is imminent


Trending News
More24/7 Live News
MoreQuick Reads
More
