

Bitcoin Price Hovers Above $60K As Traders Search For Direction
Bitcoin price started a fresh decline below the $62,500 zone. BTC is showing bearish signs and might continue to move down if it dips below $61,200.
- Bitcoin failed to stay above $63,200 and extended losses.
- The price is trading below $62,500 and the 100 hourly simple moving average.
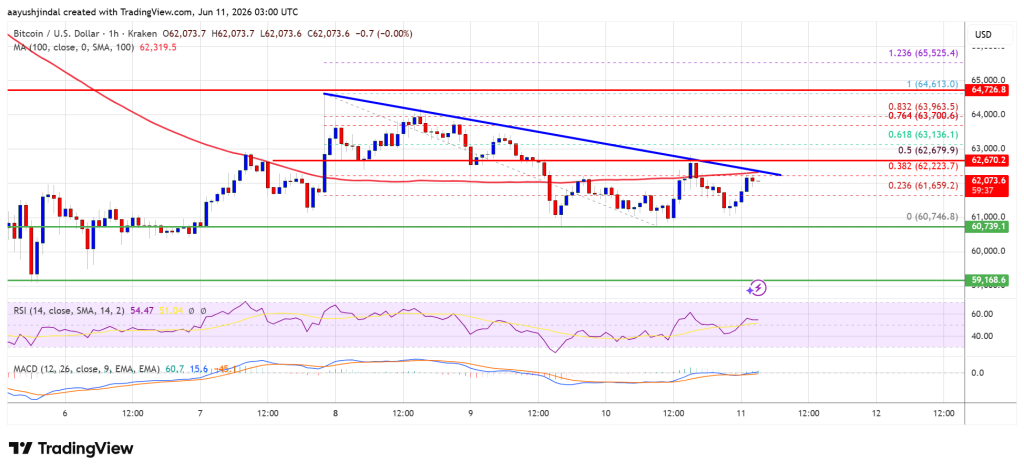
- There is a bearish trend line forming with resistance near $62,400 on the hourly chart of the BTC/USD pair (data feed from Kraken).
- The pair might extend losses if it stays below the $62,500 and $63,500 levels.
Bitcoin Price Dips Toward Support
Bitcoin price failed to stay above the $63,500 support zone. BTC remained in a bearish zone and extended losses below the $63,200 level. There was a move below the $62,500 level.
The price even dipped below $61,200. A low was formed at $60,746 and the price is still showing many bearish signs. There was a minor increase above the 23.6% Fib retracement level of the downward move from the $64,613 swing high to the $60,746 low.
Bitcoin is now trading below $62,500 and the 100 hourly simple moving average. There is also a bearish trend line forming with resistance near $62,400 on the hourly chart of the BTC/USD pair.
If the price remains stable above $60,750, it could attempt a fresh increase. Immediate resistance is near the $62,500 level and the trend line. The first key resistance is near the $63,200 level or the 61.8% Fib retracement level of the downward move from the $64,613 swing high to the $60,746 low.
A close above the $63,200 resistance might send the price further higher. In the stated case, the price could rise and test the $63,500 resistance. Any more gains might send the price toward the $64,500 level. The next barrier for the bulls could be $65,000.
More Losses In BTC?
If Bitcoin fails to rise above the $63,200 resistance zone, it could start another decline. Immediate support is near the $61,650 level.
The first major support is near the $61,200 level. The next support is now near the $60,750 zone. Any more losses might send the price toward the $60,200 support in the near term. The main support now sits at $60,000, below which BTC might struggle to recover in the near term.
Technical indicators:
Hourly MACD – The MACD is now losing pace in the bearish zone.
Hourly RSI (Relative Strength Index) – The RSI for BTC/USD is now above the 50 level.
Major Support Levels – $61,650, followed by $61,200.
Major Resistance Levels – $62,500 and $63,500.


You May Also Like

Iran’s army chief warns of ‘total destruction’ for ground invasion

South Korea Stablecoin Legislation: FSC Accelerates Crucial Regulatory Framework and Tax Review

Egyptian foreign minister to meet Putin over Iran conflict


