

Crypto Price Prediction for Today (June 6): XRP, Stellar (XLM), Chainlink (LINK)
Several major cryptocurrencies are sitting at important support levels today. XRP price has spent nearly a week under pressure, Stellar has returned to a zone that previously acted as major resistance, and Chainlink appears to be testing whether buyers still have enough strength to defend a key support area.
The next 24 hours may not completely change the broader trend, but they could provide clues about what comes next.
Support levels are being tested across all 3 assets, and any successful defense could open the door for short-term recoveries. Let’s have a look at these crypto price predictions today.
XRP Price Holds Above A Major Support Level That Has Been In Place Since November 2024
XRP price closed lower again yesterday. That marked the fifth straight day of losses as sellers continued to control the market.
The decline pushed Ripple’s token back toward the important $1.0 support zone. This level has remained intact since November 2024, which makes it one of the most important price areas on the XRP chart.
A break below $1.0 may not happen easily because it is a long term support.
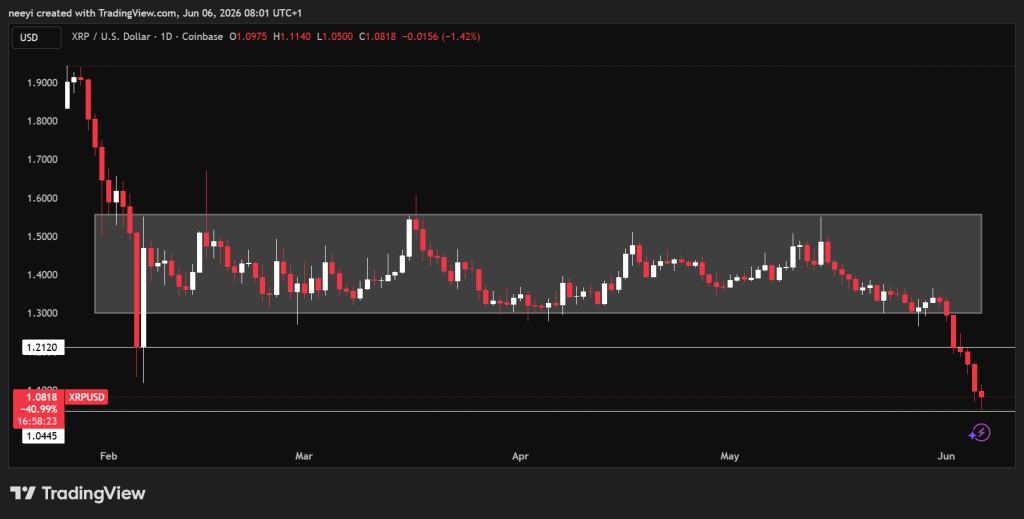 XRP Price Chart / TradingView.com
Even so, the overall XRP price outlook remains bearish today. Any upward move that develops during the session would currently be viewed as a retracement unless XRP can reclaim higher resistance levels.
The first important level sits near $1.21. A move above that area would weaken bearish pressure. Stronger bullish conditions would require a break above $1.30.
The broader bearish structure would only begin to lose strength if XRP eventually moves above $2.21.
A look at XRP’s momentum indicators shows that sellers still maintain an advantage.
The Relative Strength Index currently stands at 30.949. That reading places XRP close to oversold territory and indicates continued weakness.
The Stochastic Oscillator sits at 26.033. This reading points to weak buying activity despite the recent support test.
MACD remains negative at -0.053. That shows downward momentum continues to dominate price action.
The Ultimate Oscillator is currently 36.37. Values below 50 typically indicate sellers still have greater control.
| Name Of Indicator | Metrics | Interpretation Of Metrics |
|---|---|---|
| RSI (14) | 30.949 | Sell |
| STOCH (9,6) | 26.033 | Sell |
| MACD (12,26) | -0.053 | Sell |
| Ultimate Oscillator | 36.37 | Sell |
XRP Price Prediction For Today
Bullish Scenario
XRP would need to break above $1.21 and then push beyond $1.30. Such a move appears unlikely within a single trading session.
Neutral Scenario
A move above $1.21 would weaken the bearish outlook. XRP could then consolidate between $1.21 and $1.30.
Bearish Scenario
Trading between $1.0 and $1.21 appears most likely today. Sellers may struggle to push XRP below $1.0 after reaching a support level that has held for roughly 16 months.
Stellar Price Tries To Build A Recovery After Bouncing From Key Support
XLM price tested support near $0.184 yesterday. This area previously acted as resistance between February and May before eventually turning into support.
Buyers stepped in near that level late yesterday. The reaction helped Stellar recover from its intraday lows.
XLM price is now trading near $0.194. That places the token close to the same support area once again.
Another successful defense of $0.184 could allow Stellar to extend its recovery attempt.
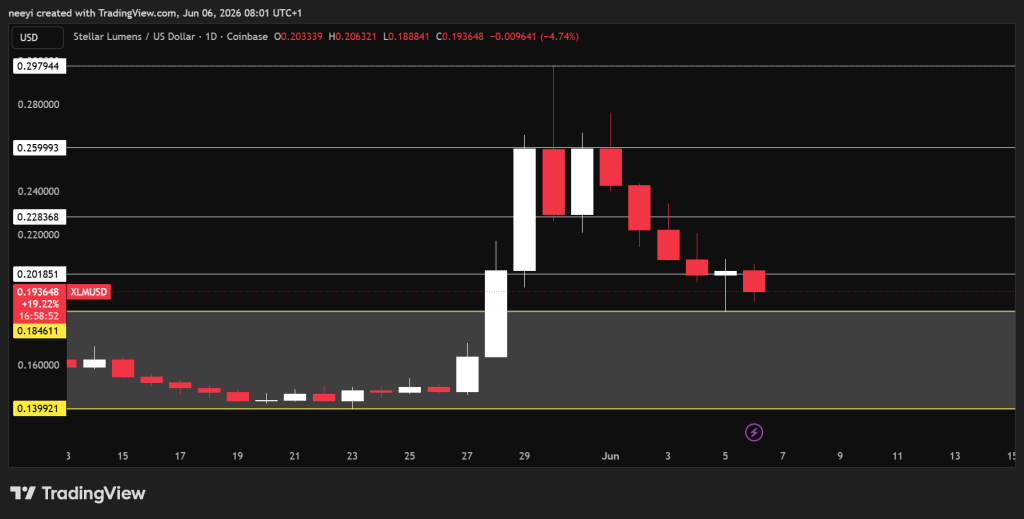 XLM Price Chart / TradingView.com
The first important resistance sits near $0.20. A break above that level would reduce bearish pressure and could allow the price to spend some time between $0.20 and $0.228.
Additional upside would require a move above $0.228. That could open the door for a test of $0.259.
Current technical indicators continue to favor sellers despite the recent bounce.
The RSI reading stands at 42.341. This shows momentum remains relatively weak.
The Stochastic Oscillator sits at 23.034. That reading indicates buying pressure remains limited.
MACD remains negative at -0.007. Downward momentum has not disappeared yet.
The Ultimate Oscillator currently reads 38.493. This value continues to support a bearish outlook.
| Name Of Indicator | Metrics | Interpretation Of Metrics |
|---|---|---|
| RSI (14) | 42.341 | Sell |
| STOCH (9,6) | 23.034 | Sell |
| MACD (12,26) | -0.007 | Sell |
| Ultimate Oscillator | 38.493 | Sell |
Stellar Price Prediction For Today
Bullish Scenario
A move above $0.20 would weaken the bearish outlook. Stronger bullish conditions would require a break above $0.229.
Neutral Scenario
XLM could move above $0.20 and spend the remainder of the day trading between $0.20 and $0.228.
Bearish Scenario
Trading below $0.20 keeps the bearish structure intact. The $0.184 support level could continue holding throughout today’s session.
Chainlink Price Attempts To Recover After Defending Support Near $7.0
Chainlink price appears close to a potential reversal after bouncing from support around $7.0. LINK is currently trading near $7.3. That places the token just below an important resistance level.
The first level buyers need to overcome sits near $7.4. A break above that area would neutralize the current bearish outlook.
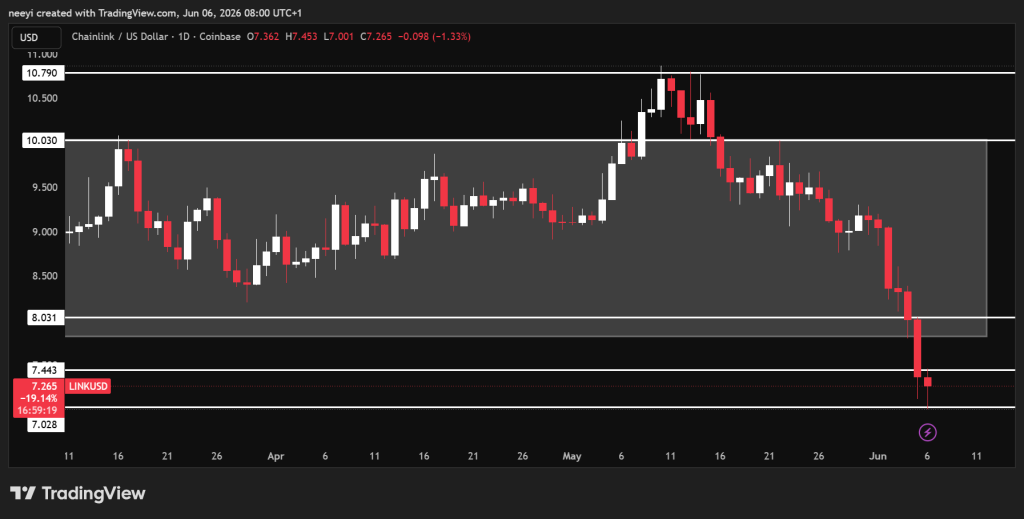 LINK Price Chart / TradingView.com
Stronger bullish conditions would require a move above $8.0. Until that happens, sellers still maintain the broader advantage.
Technical indicators remain weak despite the recent bounce from support.
RSI currently stands at 29.221. That places Chainlink in oversold territory.
The Stochastic Oscillator reads 22.366. This points to weak buying participation.
MACD remains negative at -0.42. Downward momentum continues to influence price action.
The Ultimate Oscillator currently stands at 35.063. This reading also favors sellers.
| Name Of Indicator | Metrics | Interpretation Of Metrics |
|---|---|---|
| RSI (14) | 29.221 | Sell |
| STOCH (9,6) | 22.366 | Sell |
| MACD (12,26) | -0.42 | Sell |
| Ultimate Oscillator | 35.063 | Sell |
Chainlink Price Prediction For Today
Bullish Scenario
A bullish outcome would require LINK price to break above $8.0. Such a move appears unlikely today.
Neutral Scenario
A break above $7.4 would neutralize the bearish outlook and improve conditions for buyers.
Bearish Scenario
Chainlink could continue trading between $7.0 and $7.4 for the remainder of the day.
FAQs
Subscribe to our YouTube channel for daily crypto updates, market insights, and expert analysis.
The post Crypto Price Prediction for Today (June 6): XRP, Stellar (XLM), Chainlink (LINK) appeared first on CaptainAltcoin.


You May Also Like

JPMorgan and top US banks plan tokenized deposit network by 2027

Ripple (XRP) Could Triple Soon as Dogecoin (DOGE) and This New Coin Target 10x Gains
Dragonfly holds ZEC as Orchard bug debate raises new questions


Trending News
More24/7 Live News
MoreQuick Reads
More
