

XRP (XRP) Crashes Through Critical Support — Next Price Targets Revealed
Key Takeaways
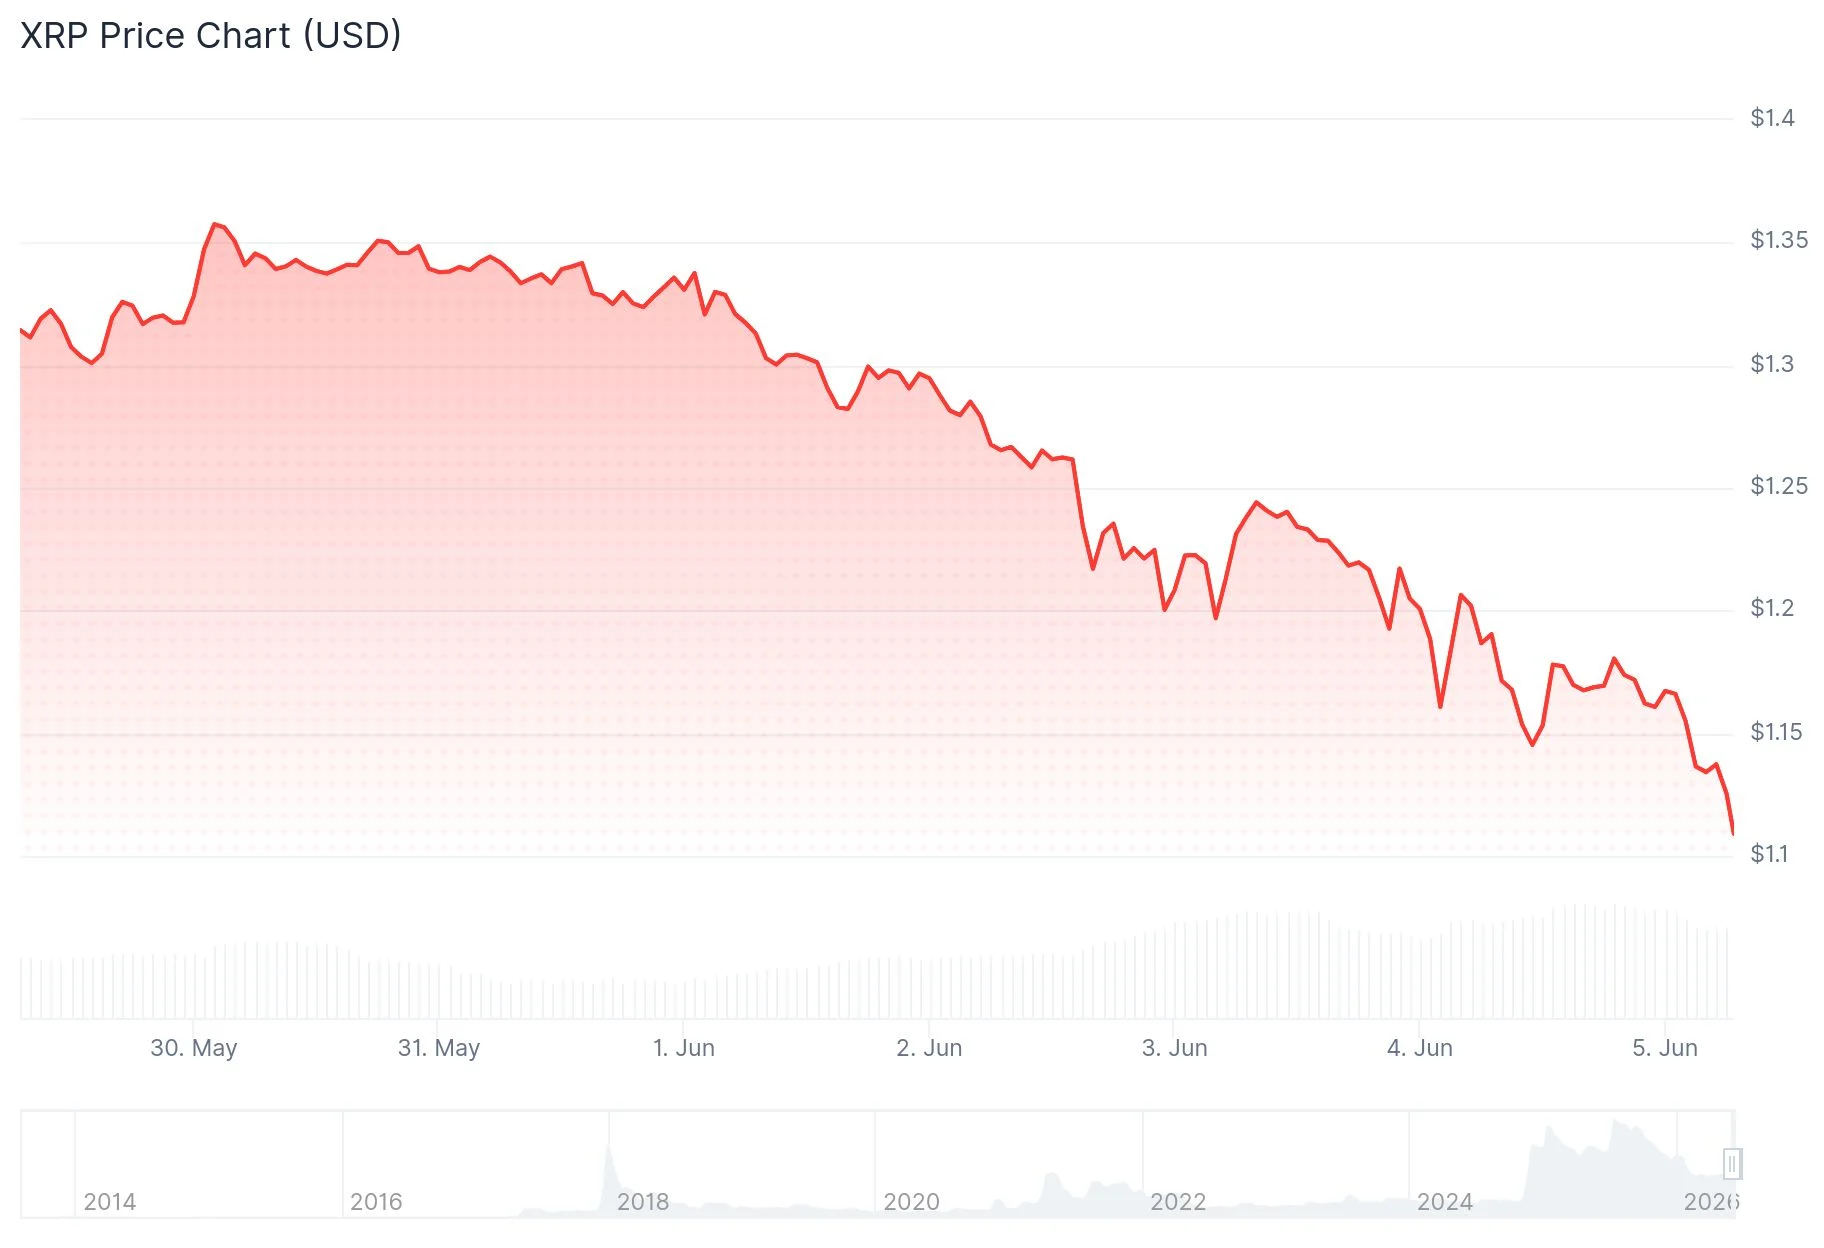
- XRP has crashed through a critical consolidation zone maintained for four months, currently hovering between $1.16 and $1.18 after a 6%+ decline in one day.
- A crucial support floor ranging from $1.26 to $1.28, which successfully defended the price throughout March and April, has been decisively violated.
- All significant moving averages now trade above current price levels, including the 200-day EMA positioned above $1.60, signaling persistent downward momentum.
- Should the $1.14–$1.18 support zone fail to hold, market analysts have identified bearish targets extending down to $0.92, with extreme scenarios reaching $0.63.
- The Relative Strength Index has plummeted to approximately 24, entering deeply oversold conditions, though broader technical indicators maintain a bearish stance.
XRP has experienced a significant breakdown from a prolonged consolidation pattern that persisted for almost four months. Current trading activity places the cryptocurrency between $1.16 and $1.18, substantially beneath the range boundary that successfully defended against downward pressure from March through April.
 XRP Price
The extended consolidation phase featured a resistance ceiling around $1.55 and established support spanning $1.26 to $1.28. This lower boundary has now given way, with XRP experiencing approximately 6.1% depreciation within a 24-hour trading window.
Market analyst “Guy on the Earth” shared technical charting on X platform, illustrating XRP hovering near $1.279 — precisely at the range minimum — immediately preceding the subsequent decline. His technical assessment pinpointed $1.10 as the initial bearish objective following the support failure, a price point corresponding with the February wick bottom.
Current price movement suggests this projection is materializing. XRP has already penetrated below the established range floor, positioning the $1.10 objective within striking distance.
Moving Average Indicators Paint Bearish Picture
The technical landscape presents overwhelming bearish characteristics. XRP presently trades beneath virtually every significant moving average. The 10-day exponential moving average hovers around $1.27, while the 50-day EMA sits near $1.36, and the 200-day EMA exceeds $1.60. According to market analysts, reversing the negative sentiment would require XRP to recapture the $1.30 threshold supported by substantial trading volume.
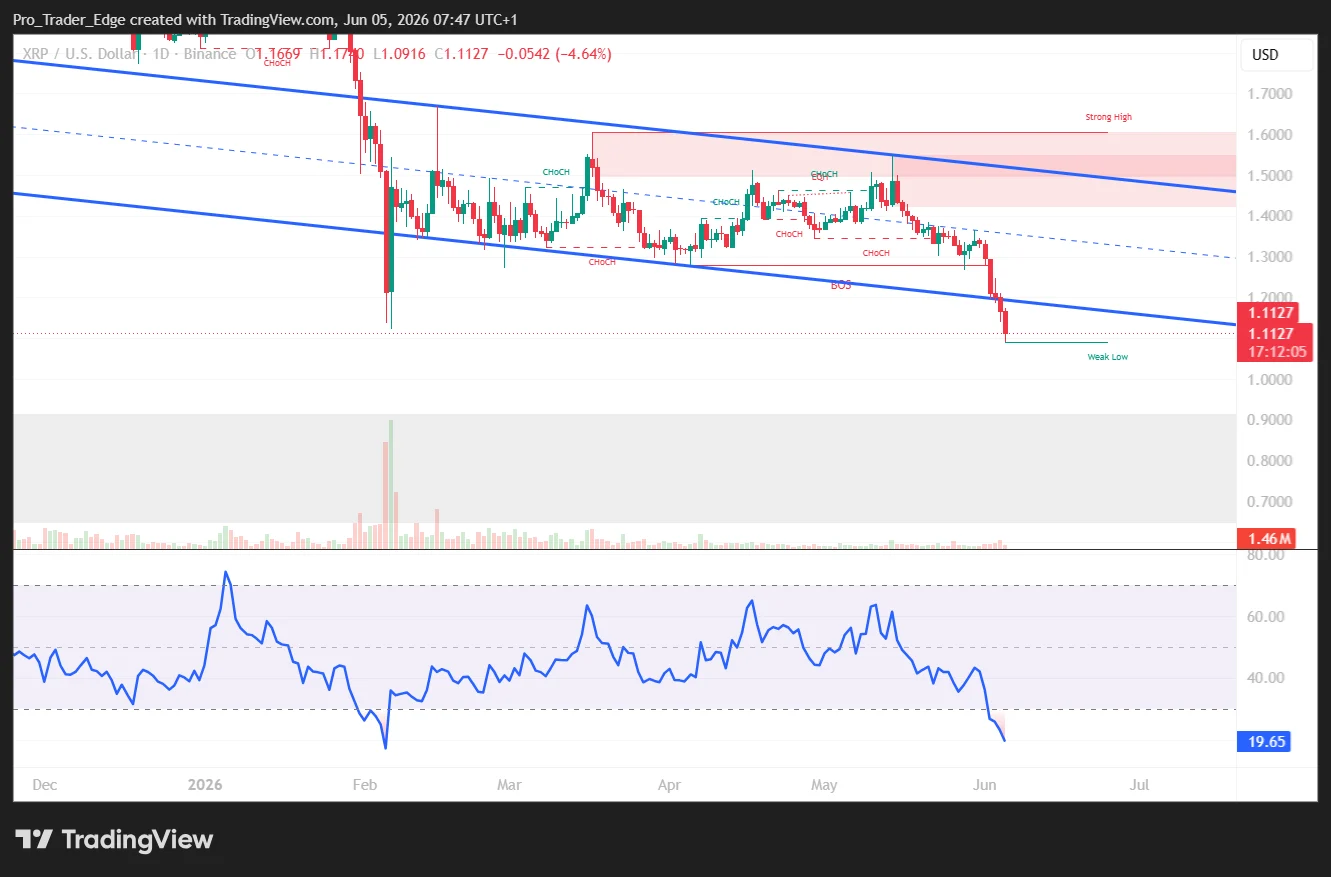 Source: TradingView
TradingView’s comprehensive technical assessment indicates a neutral-to-bearish outlook, with moving average indicators producing the most pronounced sell signals.
Potential Downside Price Objectives Under Scrutiny
Independent analyst Crypto Patel, communicating via X platform, characterized the $1.10–$1.30 range as an active accumulation territory. He indicated that a breach of this zone could establish the $0.65–$0.85 range as a significant accumulation opportunity.
Analyst “Guy on the Earth” positioned the probable bottom formation between $0.75 and $0.95 during a sustained breakdown scenario, identifying an extreme downside level near $0.63 — a threshold that would eliminate the majority of XRP[[/link_end_3]]’s appreciation since late 2023.
Additional technical analysis from trader Blacksea highlighted on X that XRP appears to be developing an identical falling wedge formation observed in 2024, immediately preceding significant price volatility. Blacksea observed this pattern historically correlates with aggressive trend reversals, although present price behavior hasn’t yet validated any breakout scenario.
Fibonacci retracement analysis identifies a level near $0.92 that corresponds with a heavily monitored support territory between $0.87 and $0.92. Pivot point calculations similarly emphasize $1.097 as an immediate downside level with $0.811 representing deeper support infrastructure.
The 14-period RSI has declined to approximately 24.26, penetrating below the oversold benchmark of 30. The Commodity Channel Index registers around -232. Daily transaction volume maintains levels exceeding $3 billion, demonstrating sustained market interest in XRP.
At the time of publication, XRP was exchanging hands at approximately $1.17.
The post XRP (XRP) Crashes Through Critical Support — Next Price Targets Revealed appeared first on Blockonomi.


You May Also Like

Dogecoin Has Entered A Historically Red Month And The Result Could Be Catastrophic

Selling Pressure is Increasing in Bitcoin! Here Are the Next Key Support Levels According to Analysts!

Japanese Yen Consolidates in Tight Range Versus US Dollar, UOB Reports


