

ServiceNow Stock Rebounds, But 200-Day EMA Still Caps the Move

ServiceNow Stock extends a short‑term rebound, while the broader trend repair remains incomplete. Daily structure tilts constructive above near‑term averages, yet price sits well below the 200‑day. Recent analyst attention keeps focus high, but price levels remain the arbiter.
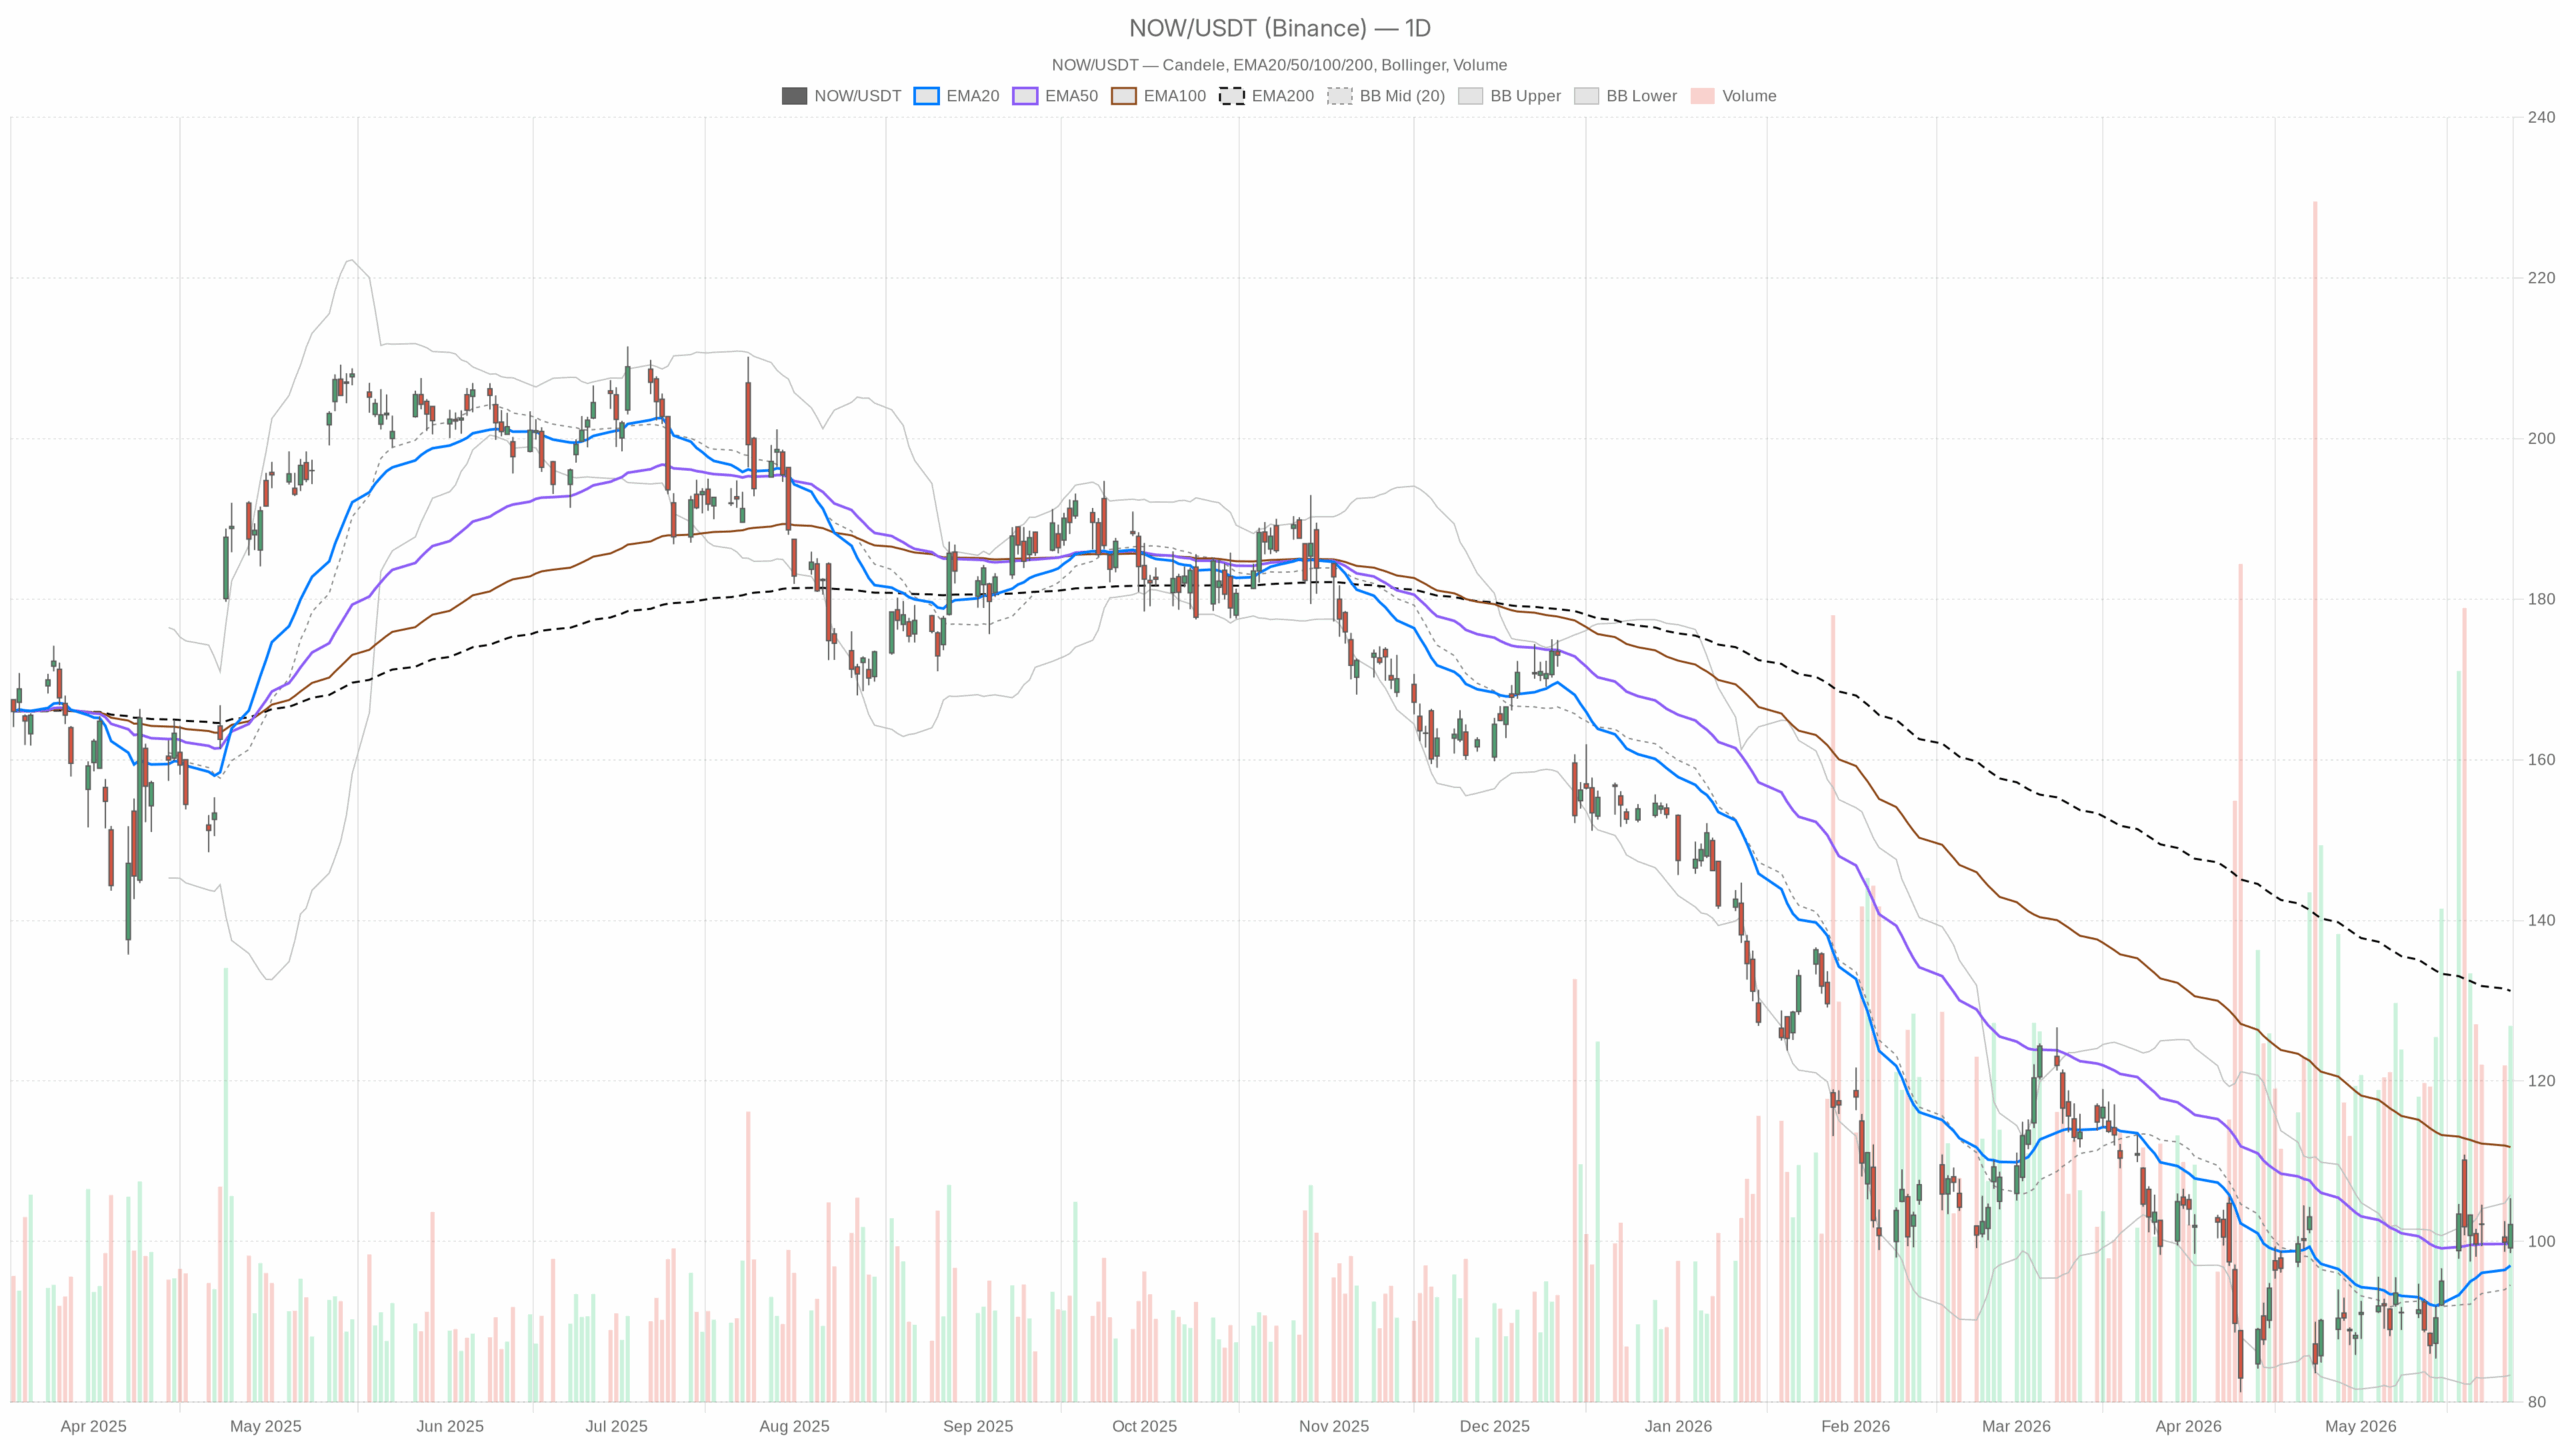 NOW — daily chart with candlesticks, EMA20/EMA50 and volume.
ServiceNow Stock Daily Technical Outlook
NOW closed at 102.12 after a 98.55–105.40 range. Price sits above the 20‑day EMA 97 and the 50‑day EMA 99.78, but below the 200‑day EMA 131.21 (Implication: short‑term strength within a longer‑term overhang).
The daily RSI 57.03 is constructive, not overbought. The MACD 1.57 versus a 0.16 signal yields a +1.41 histogram (Implication: positive trend impulse is building). Meanwhile, Bollinger Bands center at 94.58 with an upper near 105.8 and a lower at 83.36. Implication: price is operating in the upper half with room to test band resistance.
The ATR(14) 5.84 signals elevated daily volatility. Therefore, swings can widen both ways. Daily pivot levels show PP 102.02, R1 105.5, and S1 98.65 (Implication: 102 is a battleground, 105.5 near resistance, and 98.65 first support).
Hourly Intraday Setup for ServiceNow Stock
On the 1H chart, the regime reads bullish. Price is near the 20‑EMA 102, above the 50‑EMA 100.39 and the 200‑EMA 96.59 (Implication: intraday uptrend intact). The 1H RSI 52.54 is neutral after a push higher.
The 1H MACD 0.55 versus a 0.54 signal shows a flat histogram (Implication: momentum is pausing rather than reversing). Meanwhile, Bollinger Bands center at 102.03 with 103.8 upper and 100.25 lower (Implication: consolidation near the middle of the band). The ATR(14) 1.66 implies moderate ranges. Hourly pivot is 102.49 with R1 102.86 and S1 101.79 (Implication: 102.49 immediate resistance; 101.79 first support).
15‑Minute Execution Context
Conditions are neutral with price below the 20‑EMA 102.71 and the pivot at 102.40, but above the 200‑EMA 100.16 (Implication: a shallow pullback within a broader intraday uptrend). The RSI 44.56 shows mild downside pressure, not capitulation.
The 15m MACD carries a small negative histogram at −0.10 (Implication: short‑term momentum is fading). Meanwhile, the mid‑band sits at 102.93 with price leaning toward the 102.08 lower band. The ATR 0.57 flags near‑term chop. The 15m pivot map has R1 102.70 and S1 101.88 (Implication: 101.88–102.08 is an initial support pocket).
Cross‑Timeframe Read
Therefore, for ServiceNow Stock, the cross‑timeframe read is cautiously bullish in the short run but capped by the unresolved 200‑day overhang. The daily momentum setup is improving, the hourly structure holds higher, and the 15m weakness looks like a routine dip. However, elevated daily ATR warns that swings can be abrupt.
Trading Scenarios for NOW
Bullish Scenario
Holding 101.79–102.02 and quickly reclaiming the 1H pivot at 102.49 would keep buyers in control. A push through 102.86 (1H R1) and then 103.00–103.20 would likely invite a retest of 105.40–105.50. That zone aligns with yesterday’s high, daily R1, and the upper Bollinger area near 105.8. Implication: clearing that zone would signal band expansion and strengthen the daily bull tilt.
Bearish Scenario
On the other hand, a bearish fade gains traction if price loses 101.79–101.88 and slides toward the hourly lower band near 100.25. A daily close back under the 50‑day EMA 99.78 would meaningfully weaken the repair effort. Implication: the short‑term bull case would be invalidated, refocusing risk on 98.65 daily S1. In contrast, the distant 200‑day 131.21 remains the larger structural ceiling, but it is not the immediate battle.
Catalysts and Key Zones
Notably, Oppenheimer’s reiterated rating on “healthy demand,” the Jefferies conference appearance, and elevated media attention may underpin sentiment intraday. Even so, the tape’s message is clearer: 102 is the fulcrum, 105–106 is resistance, and 98–99 is support. Overall, positioning remains tactical with a neutral‑to‑bullish bias, while high daily ATR argues for measured sizing and respect for intraday whipsaws.


You May Also Like
Kraken Unveils New Bitcoin Vault Offering 2.5% Annual BTC Returns

Trump's thugs think they've won. A traumatized nation is ready to annihilate them

Walmart-owned Sam’s Club raises its annual membership fee to $60



