Grayscale: Q3 saw another localized copycat season, how will Q4 develop?
By Grayscale
Compiled by Luffy, Foresight News
Grayscale, a crypto research firm, released its Q3 2025 crypto market insights, noting that all six major cryptocurrency sectors experienced positive price returns during the quarter, but fundamentals were mixed. Bitcoin lagged behind other sectors, exhibiting characteristics of a localized altcoin season. Grayscale also highlighted three key themes: stablecoin legislation and adoption, growing trading volume on centralized exchanges, and the rise of digital asset vaults. The report also provided an outlook on potential drivers and risks for the fourth quarter. The original content is translated below:
TL;DR
- In the third quarter of 2025, all six major cryptocurrency sectors (Crypto Sectors) had positive price returns, but fundamentals were mixed.
- Bitcoin has lagged behind other crypto market sectors this quarter, a pattern that could be considered an altcoin season, but with significant differences from previous cycles.
- The top 20 tokens in Q3 (based on volatility-adjusted price returns) highlight the importance of stablecoin legislation and adoption, rising trading volumes on centralized exchanges, and digital asset treasuries (DATs).
All crypto assets are related to blockchain technology and share the same underlying market structure, but that's where the commonality ends. This asset class encompasses a wide range of software technologies, with applications spanning consumer finance, artificial intelligence (AI), media and entertainment, and other sectors. To help streamline the market, the Grayscale research team, in collaboration with FTSE Russell, developed a proprietary classification system called "Crypto Sector." This framework covers six distinct market sectors (see Figure 1), encompassing 261 tokens with a combined market capitalization of $3.5 trillion.
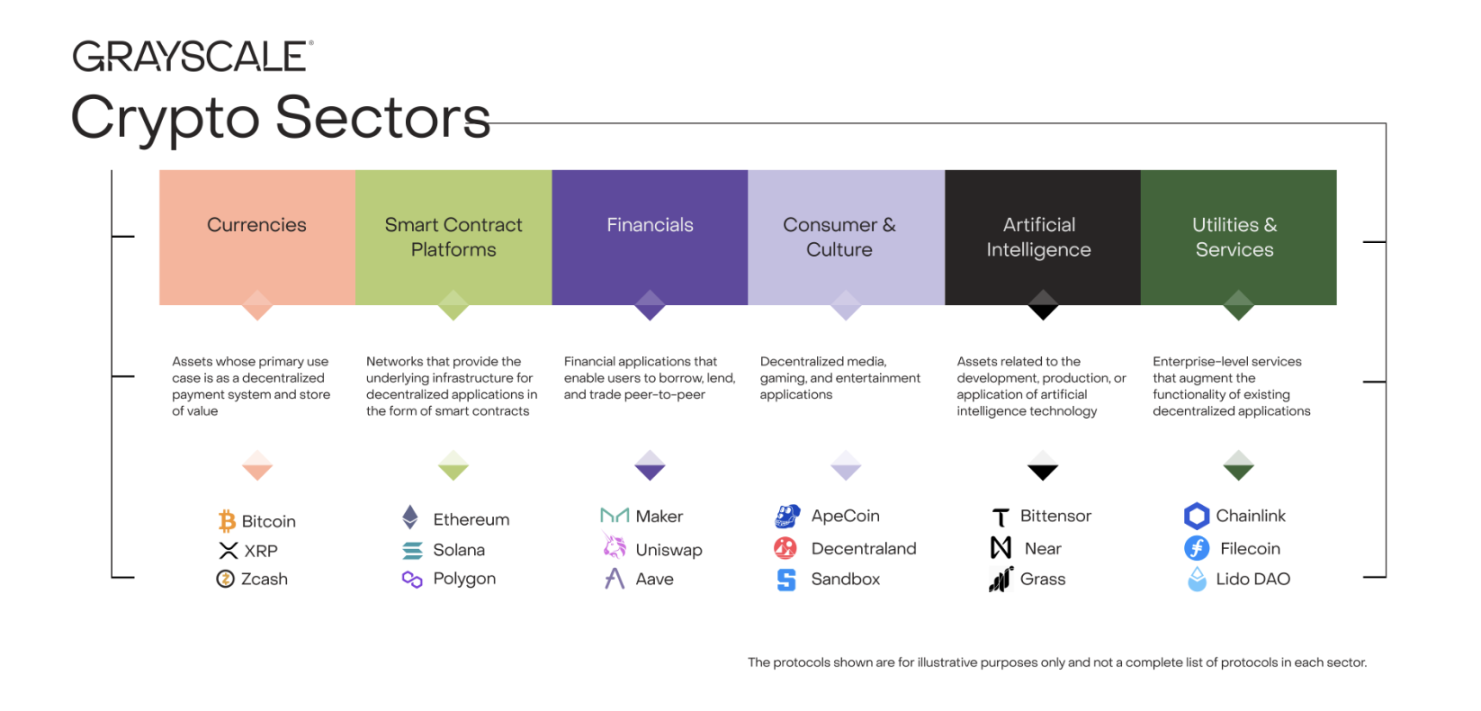
Figure 1: Cryptocurrency sector framework
Blockchain fundamentals metrics
While blockchains aren't traditional businesses, we can still use analogies to measure their economic activity and financial health. The three core metrics for on-chain activity are user base, transaction volume, and transaction fees. Due to the anonymity of blockchains, analysts often use active addresses (blockchain addresses with at least one transaction) as a proxy for user numbers.
In the third quarter, fundamentals across various cryptocurrency sectors were mixed (see Figure 2). On the negative side, both the "Currency Sector" and the "Smart Contract Platform Sector" saw month-over-month declines in user numbers, transaction volume, and fees. Overall, speculative activity related to meme coins has continued to cool since the first quarter, directly leading to a decline in both trading volume and activity.
One positive signal worth noting is that blockchain application layer fees increased by 28% month-over-month. This growth was primarily driven by a handful of leading high-fee applications, including: (1) Jupiter, a decentralized exchange within the Solana ecosystem; (2) Aave, a leading lending protocol in the crypto space; and (3) Hyperliquid, a leading perpetual swap exchange. On an annualized basis, application layer fee revenue has now exceeded $10 billion. Blockchain is both a digital transaction network and an application development platform; therefore, the growth in application layer fees can be seen as an important signal of increasing blockchain technology adoption.
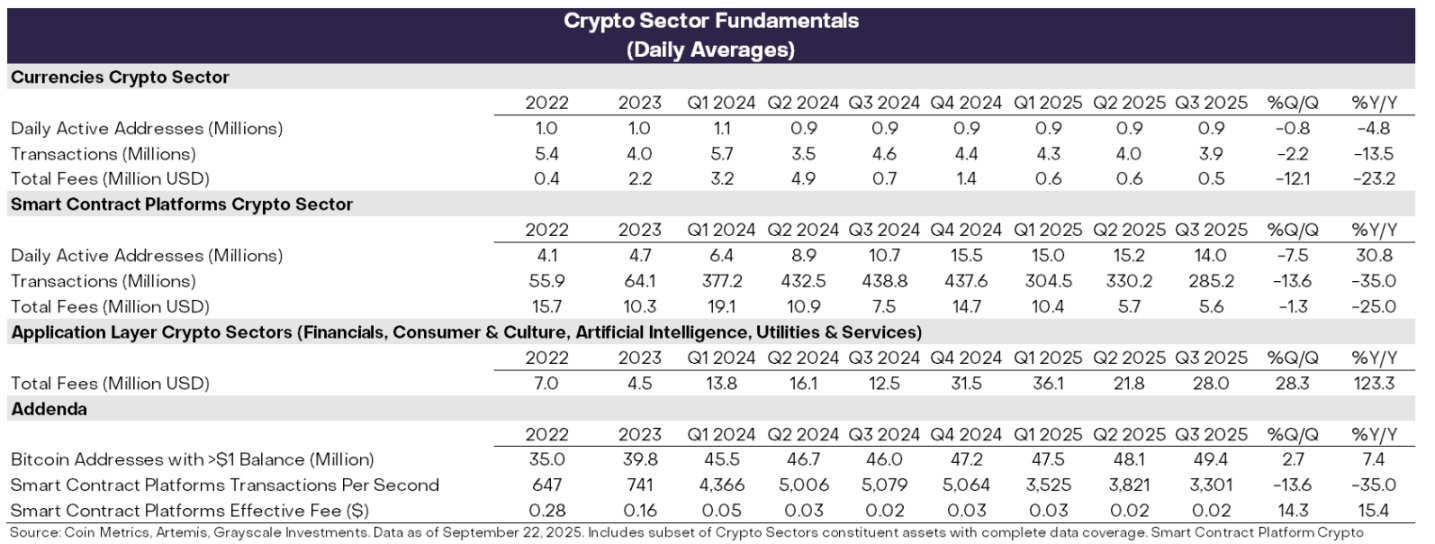
Figure 2: Mixed fundamentals across cryptocurrency sectors in Q3 2025
Price Performance Tracking
In the second quarter, all six major cryptocurrency sectors experienced positive price returns (see Chart 3). Bitcoin underperformed other market sectors this quarter, a pattern that could be considered an "alt season," but one that differs significantly from previous periods of declining Bitcoin dominance.
The financial sector led gains, primarily benefiting from increased trading volume on centralized exchanges (CEXs). The rise in the smart contract platform sector may be related to the advancement of stablecoin legislation and its implementation. While all sectors achieved positive returns, the AI sector lagged behind other sectors, a trend consistent with the sluggish returns of AI stocks during the same period. The currency sector also underperformed, reflecting the relatively modest gains in Bitcoin prices.
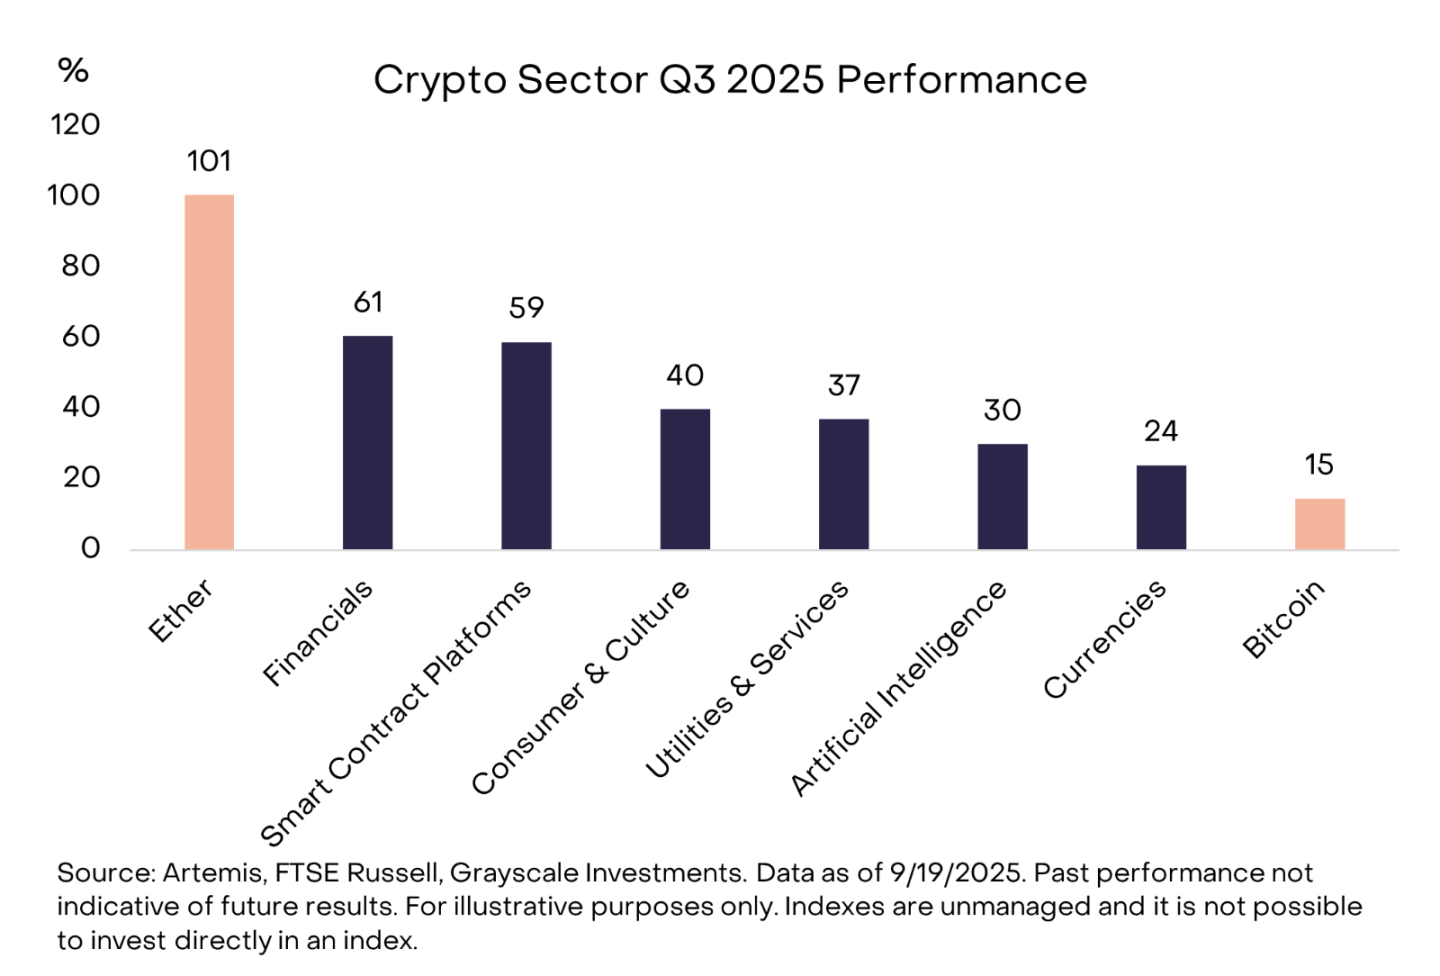
Chart 3: Bitcoin underperforms other crypto market sectors
The diverse nature of the cryptoasset class means that dominant themes and leading sectors often shift. Figure 4 shows the top 20 tokens by volatility-adjusted price returns within the Crypto Sector Index for Q3. This list includes large-cap tokens with market capitalizations exceeding $10 billion (such as ETH, BNB, SOL, LINK, and AVAX), as well as some small- and mid-cap tokens with market capitalizations below $500 million. In terms of sector distribution, the "Financials" sector (seven assets) and the "Smart Contract Platforms" sector (five assets) dominated the top 20 list this quarter.
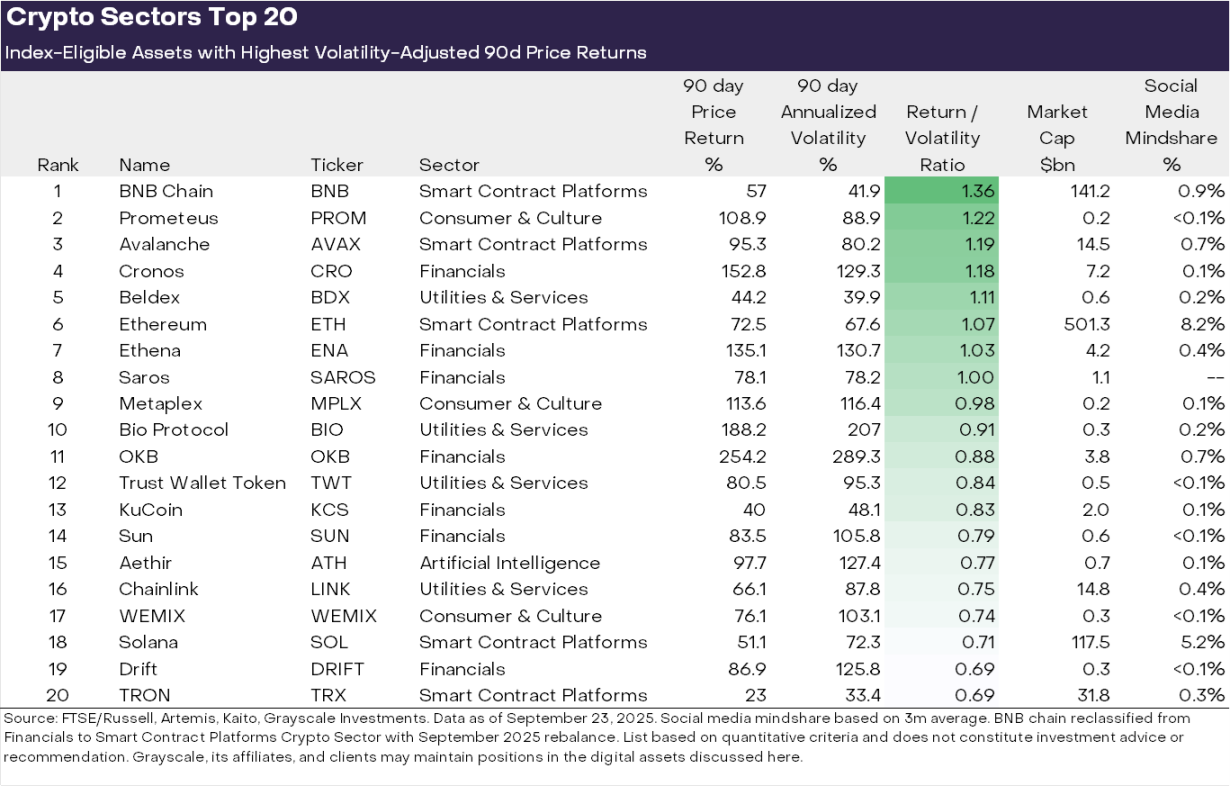
Chart 4: Top risk-adjusted performers in the cryptocurrency sector
We believe there are three key themes that stand out in the futures market:
The rise of digital asset treasuries (DATs): Last quarter saw a significant increase in the number of digital asset treasuries (DATs), which are publicly listed companies that add crypto assets to their balance sheets, providing crypto exposure to equity investors. Several tokens in this quarter's top 20 (including ETH, SOL, BNB, ENA, and CRO) may have benefited from the launch of new DATs.
Accelerating Stablecoin Adoption: Stablecoin legislation and implementation were another key theme last quarter. On July 18, President Trump signed the GENIUS Act, establishing a comprehensive regulatory framework for the US stablecoin market. Following its passage, stablecoin adoption accelerated significantly, with circulating supply increasing by 16% to over $290 billion (see Chart 5). The direct beneficiaries were smart contract platforms that facilitate stablecoin trading, including ETH, TRX, and AVAX, with AVAX experiencing significant growth in stablecoin trading volume. Stablecoin issuer Ethena also achieved strong price returns, despite its USDe stablecoin not being compliant with the GENIUS Act.
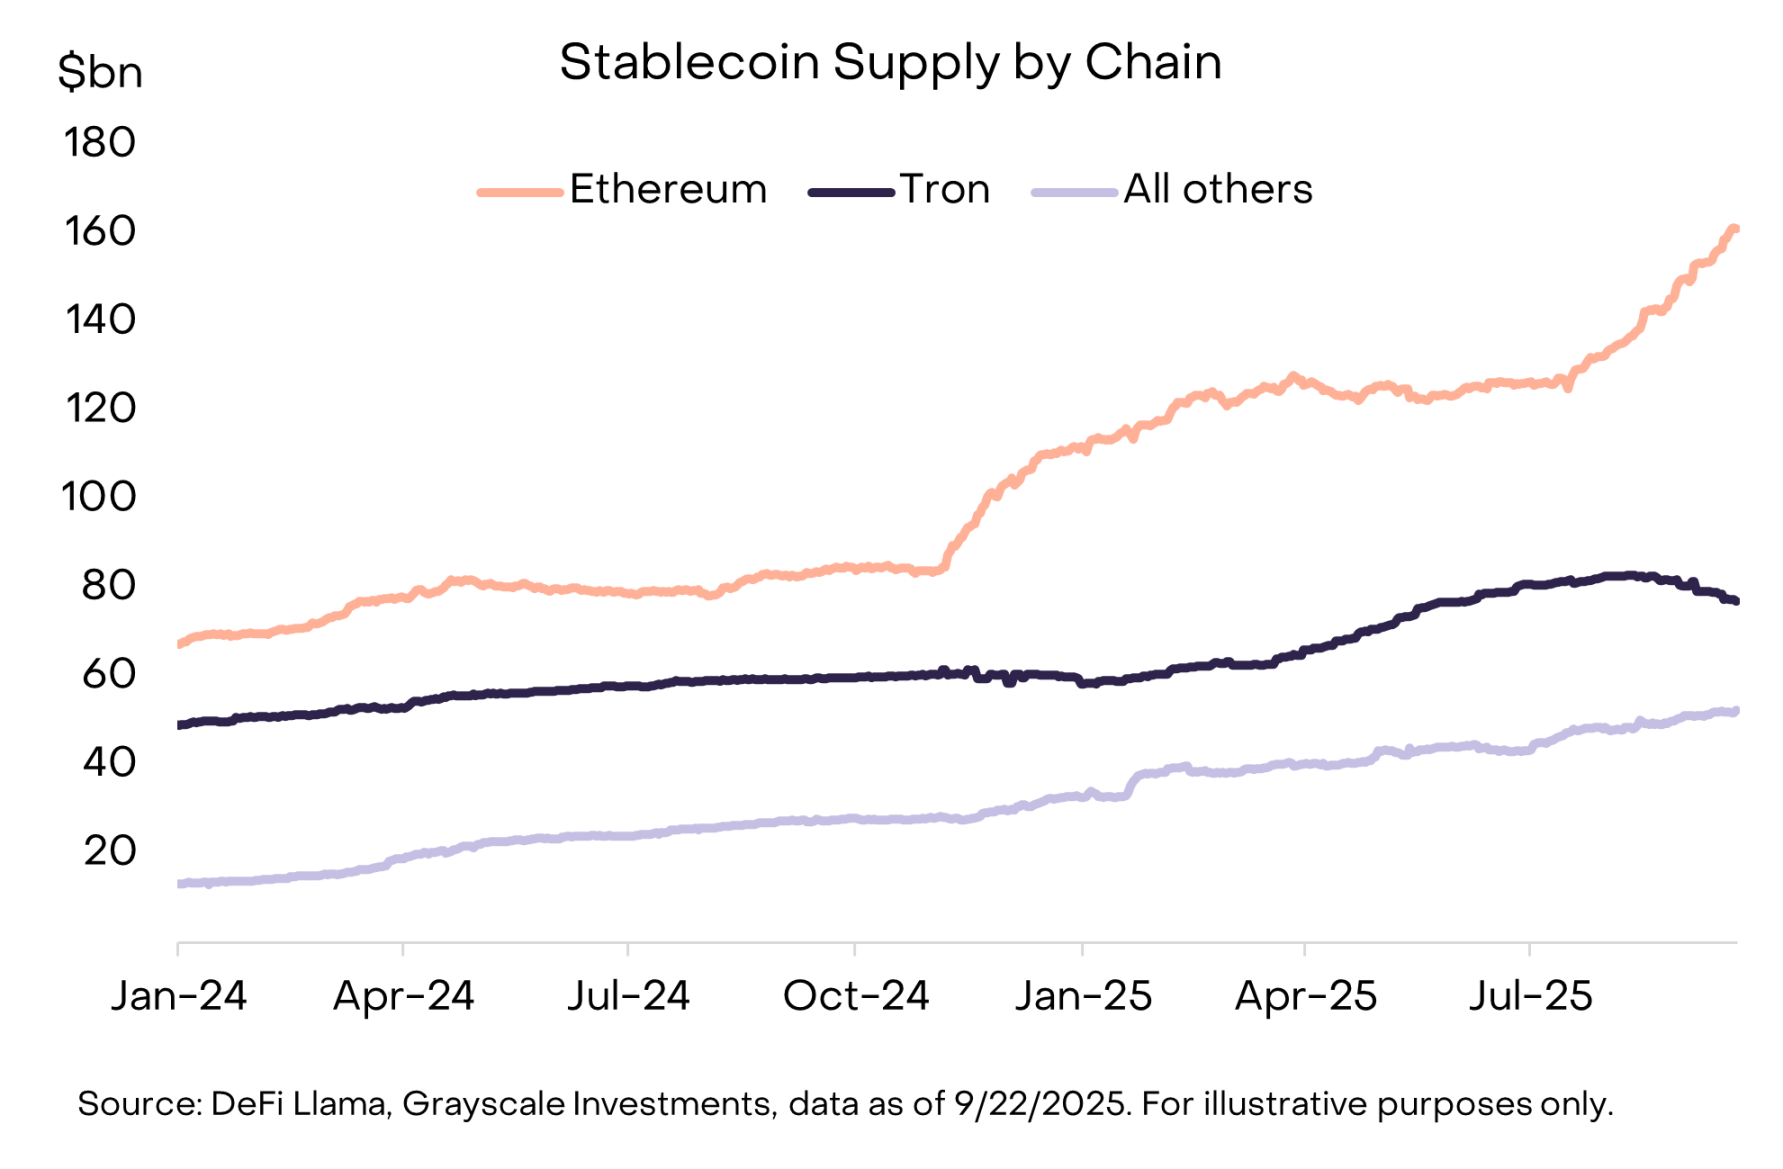
Chart 5: Stablecoin supply increased this quarter, with the Ethereum ecosystem making a significant contribution
Exchange trading volume rebounded: The third major theme was the active exchange sector. In August, centralized exchange trading volume reached a new monthly high since January (see Chart 6). This trend benefited several assets associated with centralized exchanges, including BNB, CRO, OKB, and KCS, all of which entered the top 20 list this quarter (some of which are also associated with smart contract platforms).
Meanwhile, the decentralized perpetual swaps sector continues to heat up. Hyperliquid, a leading perpetual swaps exchange, saw significant expansion this quarter, ranking among the top three cryptoasset exchanges in terms of fee revenue. Smaller competitor DRIFT, surging in trading volume, successfully entered the top 20 cryptocurrency sector. Another decentralized perpetual swaps protocol, ASTER, launched in mid-September and saw its market capitalization soar from $145 million to $3.4 billion in just one week.
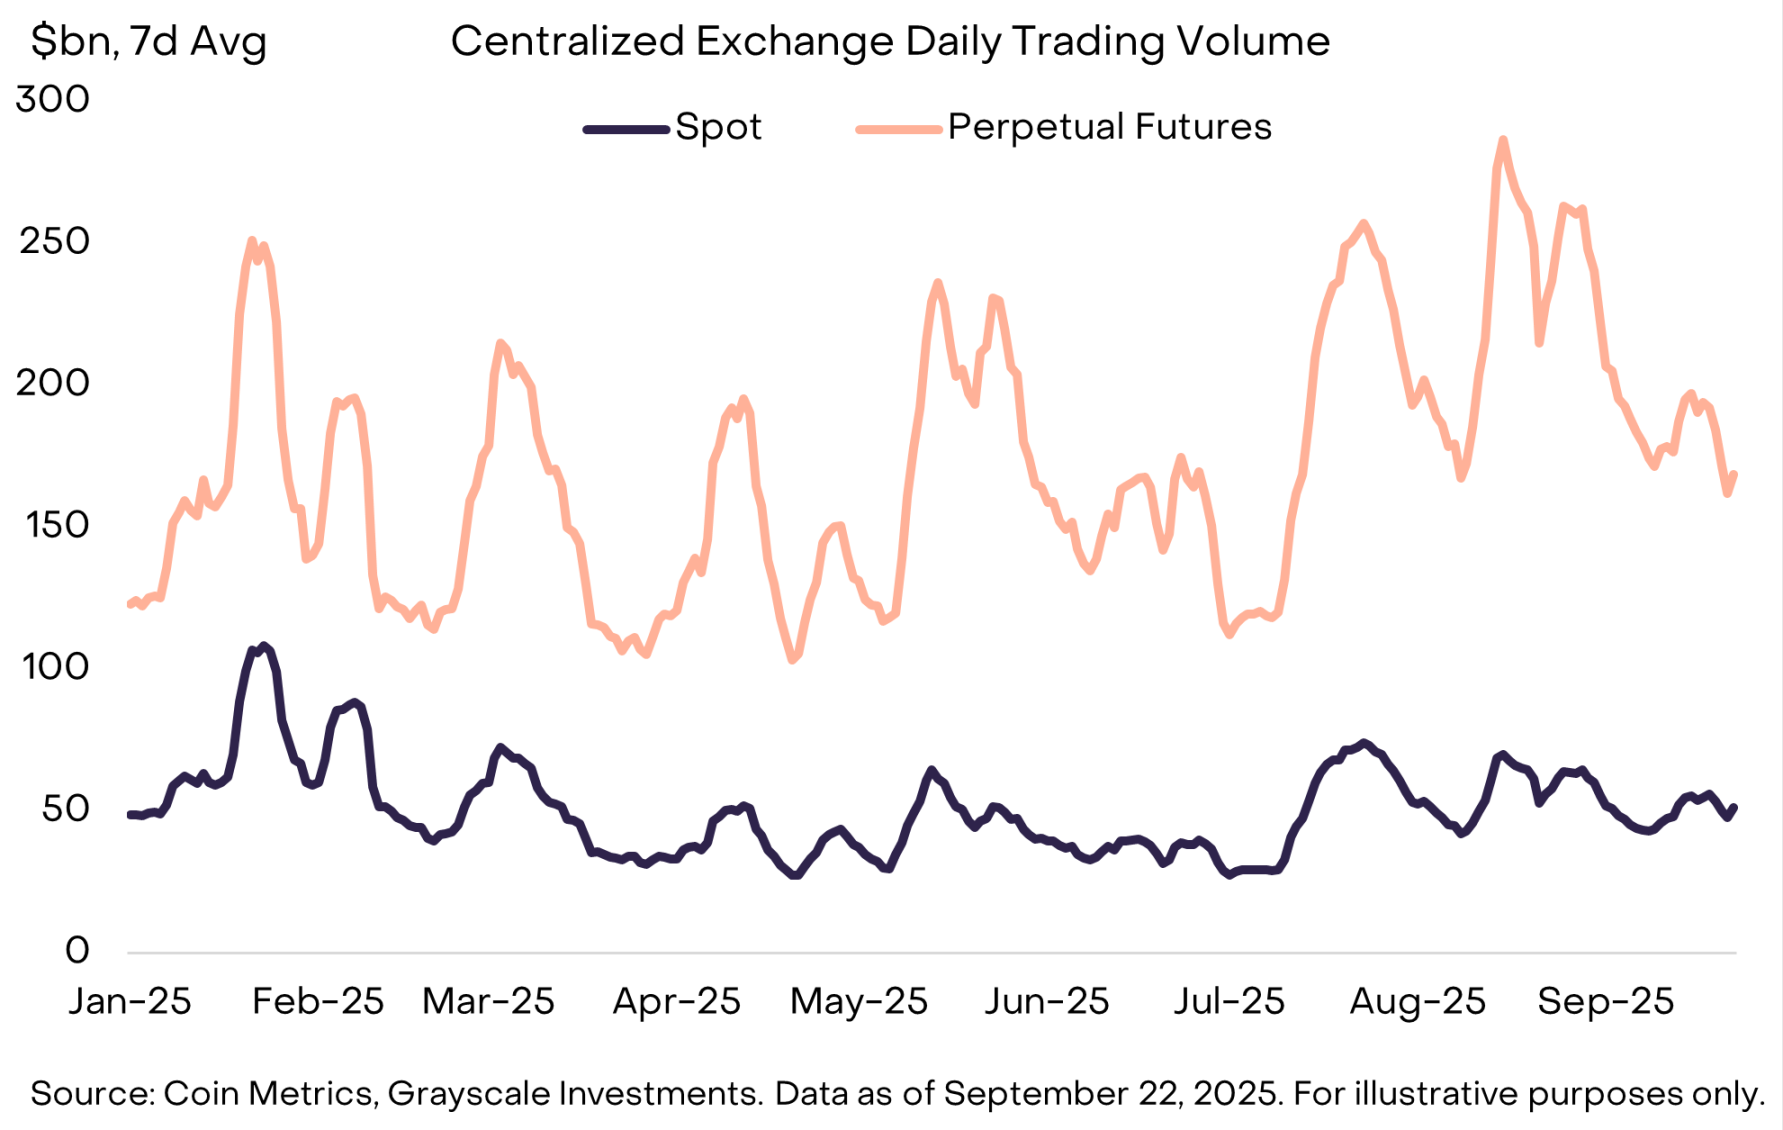
Chart 6: Perpetual swap trading volume on centralized exchanges hit a new high in August
Fourth Quarter Outlook
In Q4, the drivers of cryptocurrency sector returns are likely to differ from those in Q3. Key potential catalysts include:
First, the relevant U.S. Senate committee has begun advancing legislation on cryptocurrency market structure, following the bipartisan passage of the relevant bill in the House of Representatives in July. This bill will provide a comprehensive financial services regulatory framework for the crypto industry, potentially promoting the deep integration of the crypto market with traditional financial services.
Secondly, the U.S. Securities and Exchange Commission (SEC) has approved universal listing standards for commodity exchange-traded products (ETPs). This move could make more crypto assets available to U.S. investors through ETP structures, further expanding market access.
Finally, the macroeconomic environment is likely to continue evolving. Last week, the Federal Reserve announced a 25 basis point interest rate cut and hinted at two more rate cuts this year. Crypto assets are expected to benefit from this rate cut, as it reduces the opportunity cost of holding non-interest-bearing assets and may increase investor risk appetite. Meanwhile, a weak US labor market, high stock market valuations, and geopolitical uncertainty will be key downside risks for the crypto market in the fourth quarter.
You May Also Like
Next Couple of Months Will Be Wild for XRP: Wealth Manager
Top 5 Cryptocurrency Data APIs: Comprehensive Comparison (2025)
- EODHD (End-of-Day Historical Data) — All-in-One Multi-Asset Data EODHD is a versatile financial data provider covering stocks, forex, and cryptocurrencies. It offers an unmatched data coverage with up to 30 years of historical data across the global For crypto, EODHD supports thousands of coins and trading pairs (2,600+ crypto pairs against USD) and provides multiple data types under one service. Key features include:
- CryptoCompare — Full Market Data + More CryptoCompare is a long-standing crypto data provider that offers a rich set of market data and analytics. It not only provides price data but also aggregates news, social sentiment, and even some on-chain data, making it a comprehensive source for crypto market Key features of CryptoCompare’s API include:
- Glassnode — On-Chain Analytics Leader Glassnode is the premier platform for on-chain metrics and blockchain analytics. Unlike the other APIs in this list, Glassnode’s focus is less on real-time market prices and more on the fundamental health and usage of blockchain networks. It provides a wealth of on-chain data that is invaluable for crypto analysts and long-term investors. Key aspects of Glassnode’s API: