

Dogecoin (DOGE) Faces Fresh Downside Risk, Sellers Stay Aggressive
Dogecoin started a recovery wave above the $0.1040 zone against the US Dollar. DOGE is now facing hurdles near $0.1075 and might struggle to continue higher.
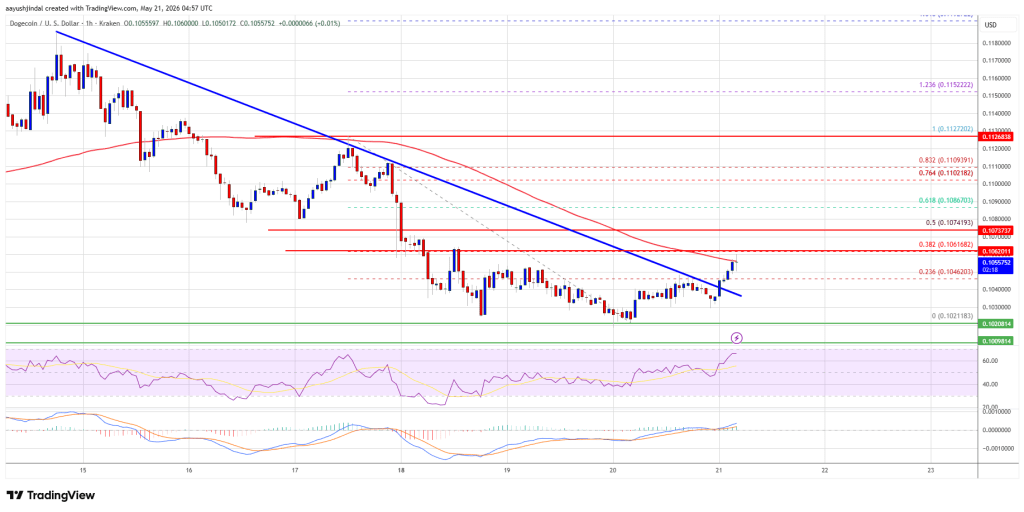
- DOGE price started a recovery wave from $0.1020 and climbed above $0.1040.
- The price is trading below the $0.1075 level and the 100-hourly simple moving average.
- There was a break above a bearish trend line with resistance at $0.1040 on the hourly chart of the DOGE/USD pair (data source from Kraken).
- The price could continue to move up if it stays above $0.1020.
Dogecoin Price Hits Resistance
Dogecoin price started a recovery wave from the $0.1020 zone, like Bitcoin and Ethereum. DOGE climbed above the $0.1035 and $0.1040 resistance levels.
There was a decent upward move above the 23.6% Fib retracement level of the downward move from the $0.1127 swing high to the $0.1021 low. Besides, there was a break above a bearish trend line with resistance at $0.1040 on the hourly chart of the DOGE/USD pair.
Dogecoin price is now trading below the $0.1075 level and the 100-hourly simple moving average. If there is another recovery wave, immediate resistance on the upside is near the $0.1062 level. The first major resistance for the bulls could be near the $0.1075 level or the 50% Fib retracement level of the downward move from the $0.1127 swing high to the $0.1021 low.
The next major resistance is near the $0.1088 level. A close above the $0.1088 resistance might send the price toward the $0.1120 resistance. Any more gains might send the price toward the $0.1150 level. The next major stop for the bulls might be $0.1165.
Another Decline In DOGE?
If DOGE’s price fails to climb above the $0.1075 level, it could continue to move down. Initial support on the downside is near the $0.1040 level. The next major support is near the $0.1020 level.
The main support sits at $0.10. If there is a downside break below the $0.10 support, the price could decline further. In the stated case, the price might slide toward the $0.09650 level or even $0.0950 in the near term.
Technical Indicators
Hourly MACD – The MACD for DOGE/USD is now gaining momentum in the bullish zone.
Hourly RSI (Relative Strength Index) – The RSI for DOGE/USD is now above the 50 level.
Major Support Levels – $0.1040 and $0.1020.
Major Resistance Levels – $0.1075 and $0.1120.


You May Also Like

Senate eyes July 6 start of VP’s impeachment trial

PHL seen to draw more investments, jobs under US-led Pax Silica, DICT says

By The Numbers: How Much Bitcoin Is Exposed To Quantum?


