Ethereum Price Rare Pattern Points to a Rebound as Key Catalysts Align
Key Insights
- Ethereum price formed an ascending triangle pattern near the $2,440 resistance zone.
- Spot Ethereum ETFs added over $270 million in early May inflows.
- Ethereum staking ratio climbed to a record high as exchange balances declined.
Ethereum price remained range-bound this month as traders watched a potential breakout above the $2,440 resistance level. ETH traded near $2,380 after consolidating for several weeks, while technical indicators continued signaling bullish momentum.
The setup gained attention as spot Ethereum ETF inflows accelerated and staking activity reached record highs.
Ethereum Price Prediction Signals Bullish Breakout Setup
The daily chart shows Ethereum price repeatedly testing the $2,440 resistance area since February. Despite several failed breakout attempts, ETH has continued printing higher lows, forming an ascending triangle structure.
Ascending triangles usually indicate rising buyer pressure beneath a horizontal resistance zone. In many cases, the pattern resolves with an upside breakout once the price closes above the resistance.
 Ethereum price chart | Source: TradingView
ETH also remained above the 50-day Exponential Moving Average (EMA), while the Supertrend indicator flipped bullish. Those indicators reflected improving momentum after Ethereum recovered from its Feb. lows.
If Ethereum price breaks above $2,440, the next major resistance sits near the psychological $2,500 level. A sustained move beyond that zone could open the path toward $3,000.
However, failure to clear the resistance may keep ETH within its broader consolidation.
ETH Price Has Some Notable Catalysts
The bullish case for Ethereum’s price is supported by notable fundamentals. From a macro level, there is a likelihood that the ongoing US-Iran conflict is about to end.
Axios reported that the two sides were prepared to reach a provisional deal as soon as this week. If this happens, it will lead to a risk-on sentiment among investors, which will boost its performance in the medium term. This risk-on sentiment explains why the US stock market soared and reached a record high this week.
At the same time, crypto traders are taking more risks as evidenced by the rising Crypto Fear and Greed Index and whale buying. The index has jumped from the extreme fear zone of 10 earlier this year to the neutral point of 50 today. Ethereum and other tokens do well when there is a sense of greed in the market.
Top American companies are moving into the crypto industry, a sign that the industry is maturing. Just this week, Morgan Stanley entered the crypto trading industry by launching trading services. Other top companies like Schwab and SoFi have also launched their services.
Meanwhile, spot Ethereum ETFs have continued gaining assets this month. These funds added $271 million in assets in the first four days of May, bringing the cumulative net inflow to $12.19 billion. BlackRock’s ETHA has gained over $7.4 billion in assets, while GrayScale’s ETH and ETHE have accumulated over $2.14 billion and $1.9 billion, respectively.
Rising Ethereum ETF inflows simply mean that Americans, especially institutional investors, believe that the coin has bottomed out. In most cases, this is a sign of an accumulation.
Ethereum’s fundamentals remain strong, with futures open interest rising and exchange supply falling to its lowest level in years.
The amount of staked Ethereum supply has jumped, with the staking ratio hitting 32%, its highest level in years. Also, the staking queue has reached a record high, a sign that investors are waiting to lock their coins for extended periods.
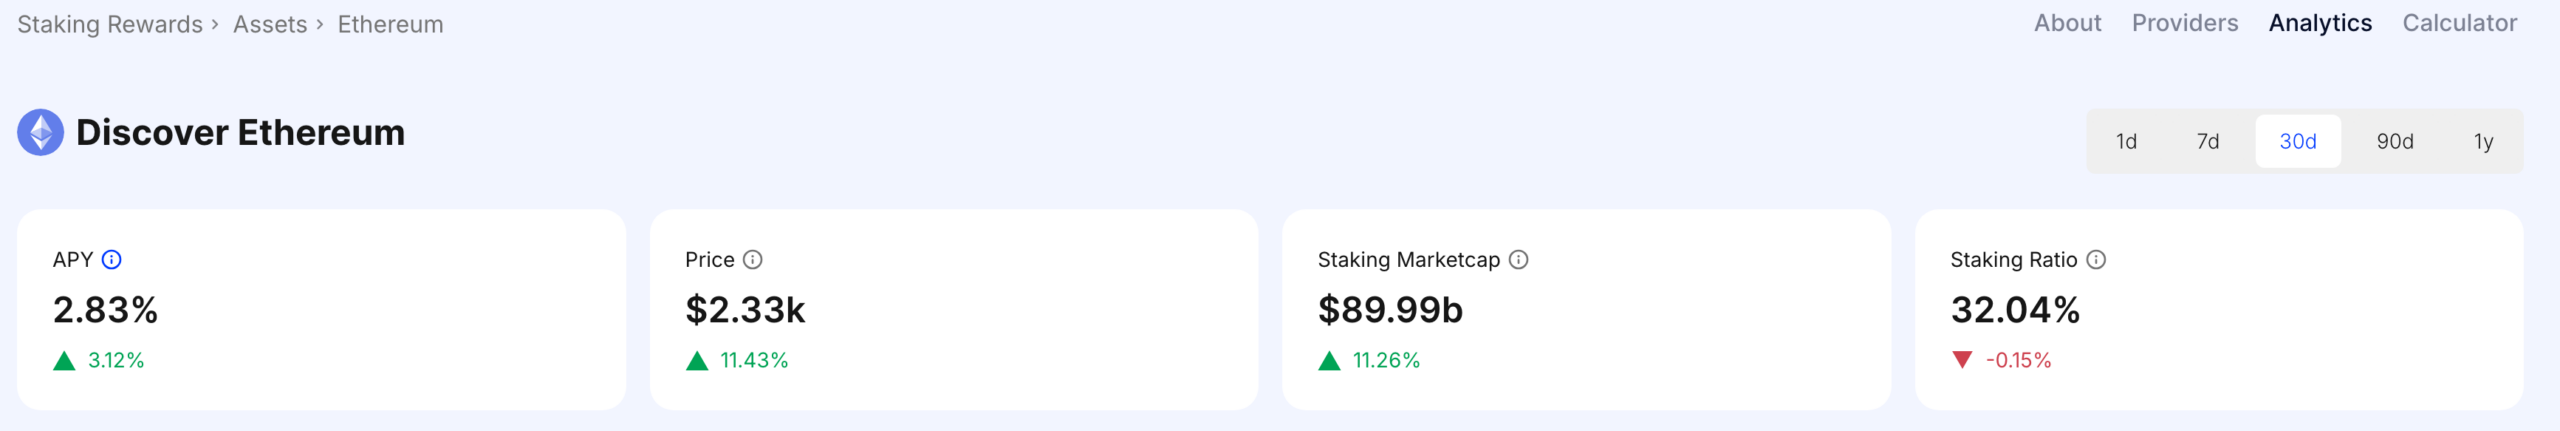 Ethereum staking is yield and ratio are rising | Source: StakingRewards
Ethereum has also become a major player in the stablecoin industry, handling billions of dollars in assets each month. Most of these coins are the popular stablecoins like USDT and USDC.
Finally, Tom Lee’s BitMine has continued buying these coins. Its accumulation phase has jumped to 100k coins per week, suggesting it may end its buying spree in July.
The post Ethereum Price Rare Pattern Points to a Rebound as Key Catalysts Align appeared first on The Market Periodical.


You May Also Like

BTC Price Shaky Near $67K While Oil Surges on Middle East Tensions: What's Next? (April 2 Update)
Goatseus Maximus (GOAT) Price Prediction 2026, 2027-2030