Solana (SOL) Price: Can Bulls Finally Break the $86 Wall That’s Been Holding SOL Back?
TLDR
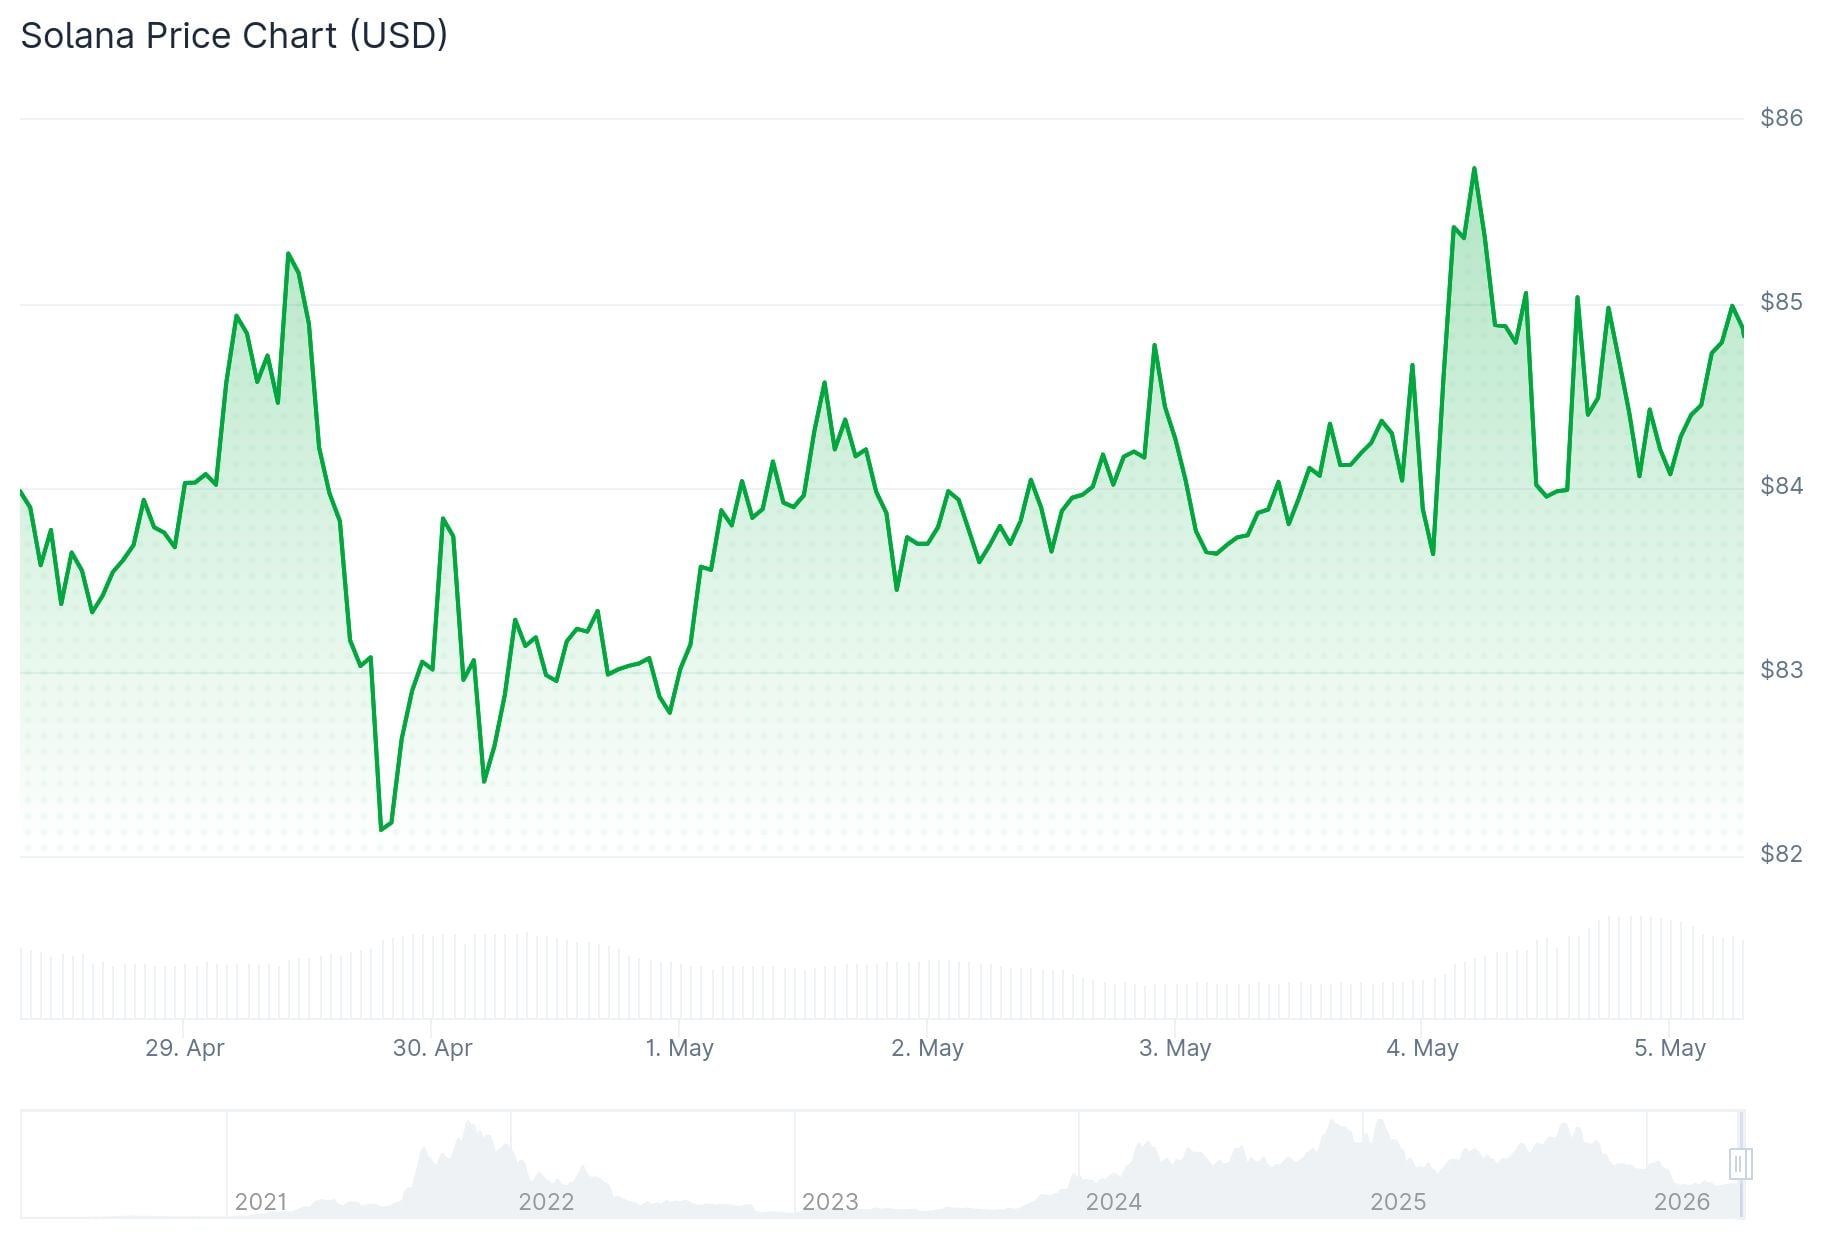
- SOL is trading around $84.94, up 1.32% in the last 24 hours, with a market cap near $48.96 billion.
- The 50-day EMA at $86.10 is the key resistance level bulls need to clear for a short-term trend shift.
- SOL has traded below $100 for 90 straight days, the longest such stretch since 2020.
- Solana’s on-chain payments surpassed $10 billion in Q1 2026, showing strong network activity despite weak price action.
- Spot ETFs recorded $3.28 million in inflows on Monday, the first since April 23, suggesting early institutional interest returning.
Solana (SOL) is holding near the $85 level on Tuesday as traders watch whether bulls can push the price above a key technical barrier. The coin is trading around $84.94, up 1.32% in the past 24 hours, with a market cap of approximately $48.96 billion and daily volume of $3.05 billion.
 Solana (SOL) Price
The main focus right now is the 50-day Exponential Moving Average (EMA) sitting at $86.10. SOL has been unable to break cleanly above this level, which is keeping near-term pressure on the price.
The $86–$88 zone has acted as a ceiling for recent recovery attempts. Until SOL can hold above that area, every bounce risks forming another lower high. Just above sits the 23.6% Fibonacci retracement at $86.67, adding to the overhead supply cluster.
Analyst CryptoJack pointed out on X that SOL has struggled to reclaim the 50 EMA, and that a green rising trendline has weakened after the price slipped below it. That means bulls need to reclaim both the trendline and the 50 EMA to shift momentum back in their favor.
On the momentum side, the Relative Strength Index (RSI) is hovering near a neutral 50, and the MACD is slightly below zero. Both suggest that selling pressure is fading but buyers haven’t taken full control yet.
ETF Inflows and Derivatives Data Hint at Improving Sentiment
Institutional data offered a small positive signal. Spot Solana ETFs recorded $3.28 million in inflows on Monday, according to SoSoValue. That was the first inflow since April 23. If inflows continue through the week, it could provide additional buying support.
 Source; SoSoValue
On the derivatives side, the long-to-short ratio for SOL on CoinGlass reached 1.12 on Tuesday, the highest reading in over a month. A ratio above one means more traders are positioned for upside than downside, reflecting a cautiously bullish lean in the market.
CryptoQuant data also shows cooling conditions in spot markets and buy-side dominance in futures, with mostly neutral readings elsewhere.
On-Chain Activity Stays Strong Despite Price Weakness
One factor keeping the longer-term outlook from turning entirely negative is Solana’s network usage. Trader Symba shared data on X showing that Solana’s on-chain payments reached around 10.1 billion transactions in Q1 2026, surpassing the $10 billion mark.
That level of network activity is not typically seen alongside genuinely bearish fundamentals. The divergence between strong on-chain usage and weak price action is something traders and analysts have flagged as a potential support factor if buying interest returns.
Solana has now spent 90 consecutive days below $100, the longest stretch since 2020, according to analyst shah on X. The $100 level is now a major psychological checkpoint. A move back above it would represent a breakout from a long compression phase.
On the downside, $83–$84 is the near-term support zone. A break below that could see SOL test $80–$78.
The long-to-short ratio sitting at its highest level in over a month remains the most recent signal pointing toward renewed trader optimism.
The post Solana (SOL) Price: Can Bulls Finally Break the $86 Wall That’s Been Holding SOL Back? appeared first on CoinCentral.


You May Also Like

Silver: Downside risks build on geopolitical shock – OCBC

Trump’s Crypto Company Strikes Back: World Liberty Financial Sues Justin Sun for Defamation