

Solana (SOL) Price: Can SOL Hold $80 or Is a Drop to $60 Next? Analysts Weigh In
TLDR
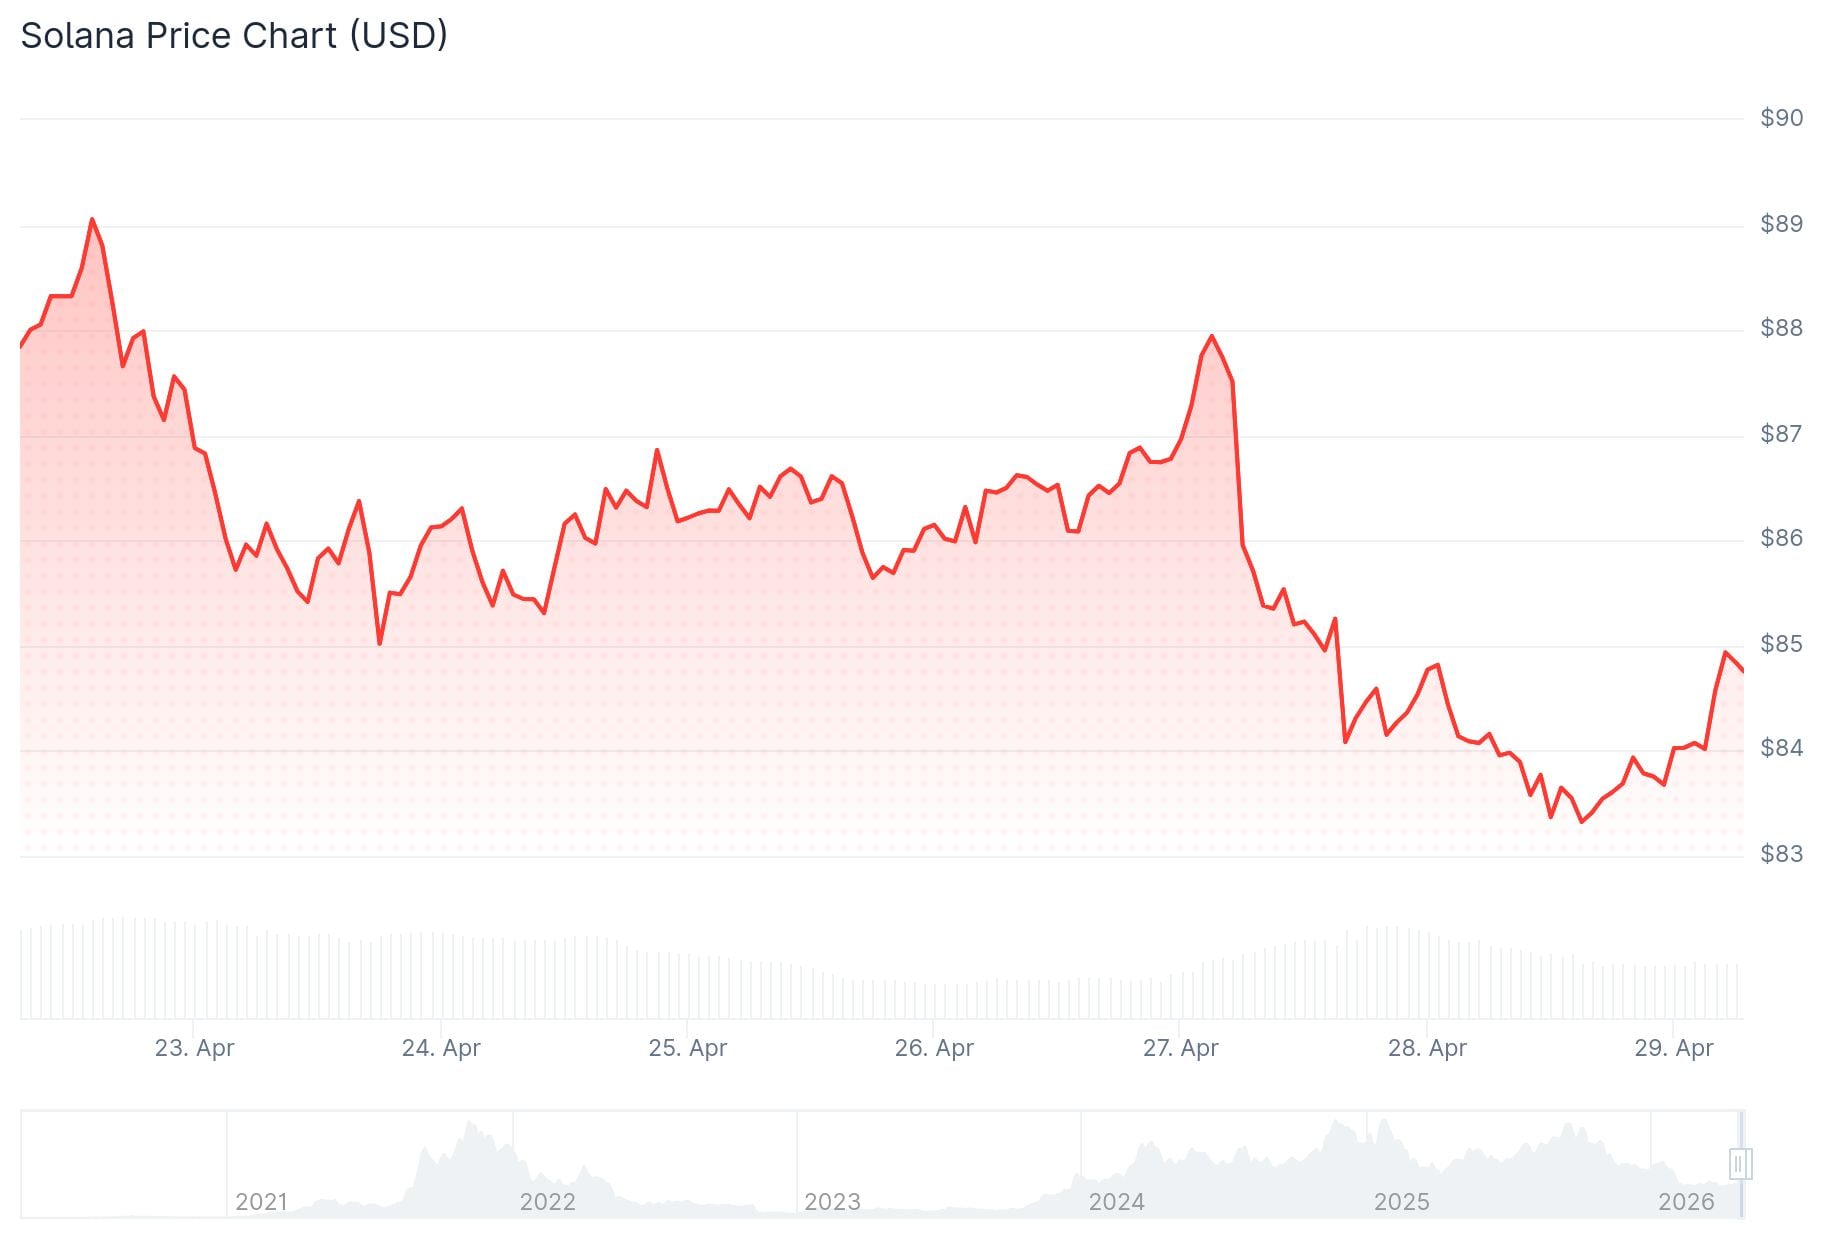
- SOL is trading around $83–$85 after losing over 3% in two days, sitting below all major moving averages.
- A head and shoulders pattern has formed on higher timeframes, with the broken neckline between $110–$120 now acting as resistance.
- The $80 level is a critical support zone; a break below could send SOL toward $75 or $70.
- Derivatives data shows a slight bullish lean, with the long-to-short ratio at 1.08 and funding rates turning positive.
- Long-term analysts see potential accumulation zones between $50–$80, with some projecting targets as high as $500–$1,000 if SOL reclaims $100.
Solana is under sustained selling pressure as of late April 2026. The asset is trading near $84.58, sitting below its 50-day, 100-day, and 200-day exponential moving averages. Each of those levels — at roughly $86.72, $95.36, and $115.06 — now acts as overhead resistance.
 Solana (SOL) Price
Price has dropped more than 3% over the past two days. The broader market mood is mixed, and buyer conviction is weak at current levels.
Analyst Crypto Tony pointed out that Solana is struggling to hold above the $85–$88 resistance band. Lower highs continue to form on the chart, which is a textbook sign of fading bullish momentum. A rejection near $90 confirmed that sellers remain active in that zone.
The $80 level is the next major floor. If that breaks, analysts see a potential slide toward $75, and then $70.
Head and Shoulders Pattern Points Lower
Analyst Mister Crypto identified a head and shoulders pattern on the higher timeframes. That pattern has already completed, with price breaking below the neckline zone between $110 and $120.
That broken neckline is now resistance. A retest of the zone is possible, but a rejection there would likely send SOL lower again. Downside targets under that scenario include $80 and potentially $60.
Only a strong close back above $120 would cancel this bearish setup and restore bullish momentum for the asset.
Derivatives Lean Bullish, But On-Chain Signals Are Mixed
Despite the weak price action, some derivatives data offers a mild counterpoint. CoinGlass data shows Solana’s long-to-short ratio at 1.08 — its highest in over a month. The OI-weighted funding rate also flipped positive on Tuesday, sitting at 0.0018%. These readings suggest traders are slightly biased toward long positions.
 Source: Coinglass
Solana’s own X account posted on Tuesday that its Real World Assets ecosystem hit a new all-time high of $2.5 billion in total value. That milestone points to growing on-chain activity, even as price struggles.
However, Santiment’s social dominance metric for SOL fell to just 0.55%. Lower social attention often reflects cooling retail interest. Spot ETF flows have also been flat this week, with little institutional activity recorded.
Analyst Crypto Patel takes a longer view, noting SOL has moved from a downtrend into a wide consolidation range. The $80 zone aligns with a Fibonacci support level. Deeper demand zones sit between $50 and $70, where long-term buyers may step in. Patel sees a possible liquidity sweep into that range before any larger move higher. Some long-term projections put SOL at $500 or even $1,000, but only after a confirmed reclaim of $100.
As of Wednesday, SOL trades below the 23.6% Fibonacci retracement at $86.67 with the RSI sitting near 48 and MACD slightly negative, reflecting cautious market conditions rather than outright collapse.
The post Solana (SOL) Price: Can SOL Hold $80 or Is a Drop to $60 Next? Analysts Weigh In appeared first on CoinCentral.


You May Also Like

Airtel crosses 650 million customers globally, becomes world’s second largest telecom operator

Token Surpasses $1.14 After Stunning 367% Rally


