Notes on Training Neural Networks for Consensus

Table of Links
Abstract and 1. Introduction
1.1 Post Hoc Explanation
1.2 The Disagreement Problem
1.3 Encouraging Explanation Consensus
-
Related Work
-
Pear: Post HOC Explainer Agreement Regularizer
-
The Efficacy of Consensus Training
4.1 Agreement Metrics
4.2 Improving Consensus Metrics
[4.3 Consistency At What Cost?]()
4.4 Are the Explanations Still Valuable?
4.5 Consensus and Linearity
4.6 Two Loss Terms
-
Discussion
5.1 Future Work
5.2 Conclusion, Acknowledgements, and References
Appendix
3 PEAR: POST HOC EXPLAINER AGREEMENT REGULARIZER
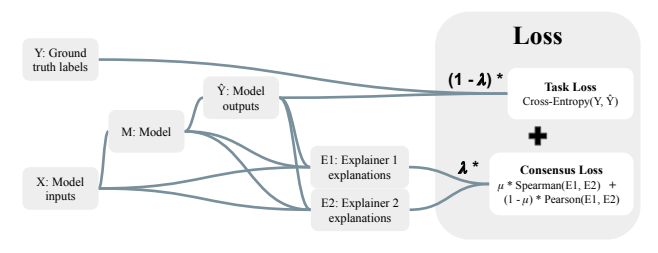
Our contribution is the first effort to train models to be both accurate and to be explicitly regularized via consensus between local explainers. When neural networks are trained naturally (i.e. with a single task-specific loss term like cross-entropy), disagreement between post hoc explainers often arises. Therefore, we include an additional loss term to measure the amount of explainer disagreement during training to encourage consensus between explanations. Since human-aligned notions of explanation consensus can be captured by more than one agreement metric (listed in A.3), we aim to improve several agreement metrics with one loss function.[2]
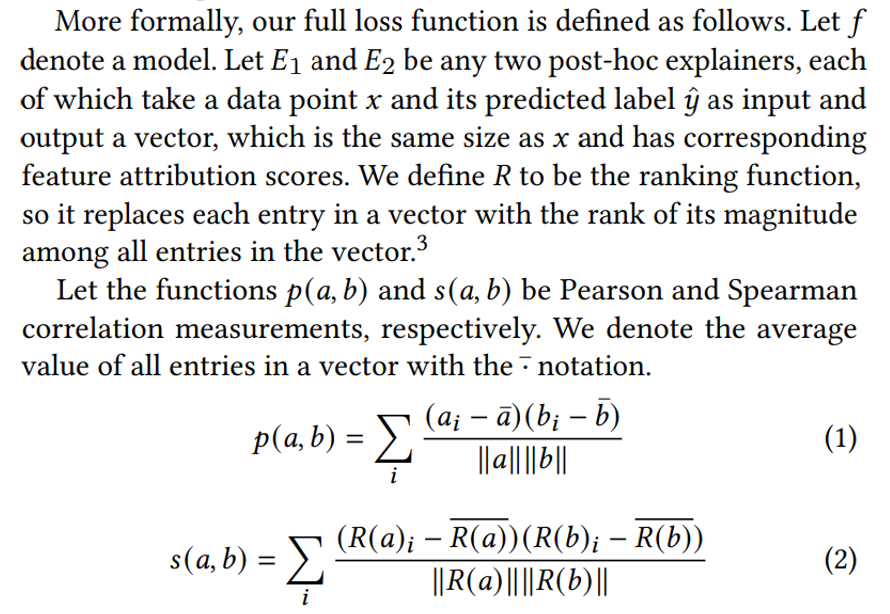
\ Our consensus loss term is a convex combination of the Pearson and Spearman correlation measurements between the vectors of attribution scores (Spearman correlation is just the Pearson correlation on the ranks of a vector).
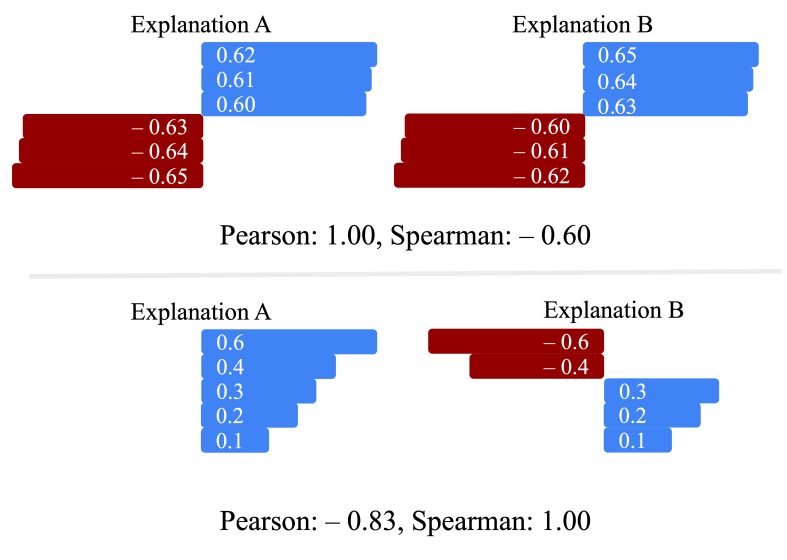
\ To paint a clearer picture of the need for two terms in the loss, consider the examples shown in Figure 3. In the upper example, the raw feature scores are very similar and the Pearson correlation coefficient is in fact 1 (to machine precision). However, when we rank these scores by magnitude, there is a big difference in their ranks as indicated by the Spearman value. Likewise, in the lower portion of Figure 3 we show that two explanations with identical magnitudes will show a low Pearson correlation coefficient. Since some of the metrics we use to measure disagreement involve ranking and others do not, we conclude that a mixture of these two terms in the loss is appropriate.
\ While the example in Figure 3 shows two explanation vectors with similar scale, different explanation methods do not always
\ 
\ 
\ align. Some explainers have the sums of their attribution scores constrained by various rules, whereas other explainers have no such constraints. The correlation measurements we use in our loss provide more latitude when comparing explainers than a direct difference measurement like mean absolute error or mean squared error, allowing our correlation measurement.
\ 
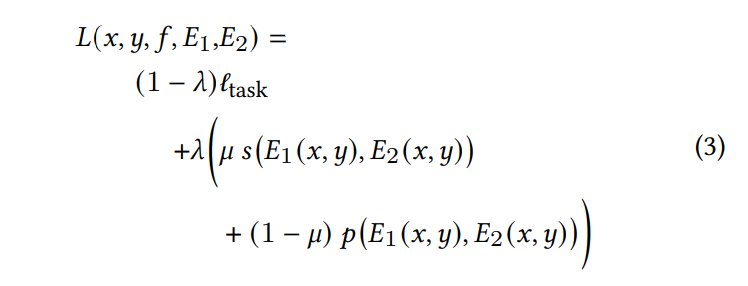
\ We refer to the first term in the loss function as the task loss, or ℓtask, and for our classification tasks we use cross-entropy loss. A graphical depiction of the flow from data to loss value is shown in Figure 2. Formally, our complete loss function can be expressed as follows with two hyperparameters 𝜆, 𝜇 ∈ [0, 1]. We weight the influence of our consensus term with 𝜆, so lower values give more priority to task loss. We weight the influence between the two explanation correlation terms with 𝜇, so lower values give more weight to Pearson correlation and higher values give more weight to Spearman correlation.
\ 
3.1 Choosing a Pair of Explainer
The consensus loss term is defined for any two explainers in general, but since we train with standard backpropagation we need these explainers to be differentiable. With this constraint in mind, and with some intuition about the objective of improving agreement metrics, we choose to train for consensus between Grad and IntGrad. If Grad and IntGrad align, then the function should become more locally linear in logit space. IntGrad computes the average gradient along a path in input space toward each point being explained. So, if we train the model to have a local gradient at each point (Grad) closer to the average gradient along a path to the point (IntGrad), then perhaps an easy way for the model to accomplish that training objective would be for the gradient along the whole path to equal the local gradient from Grad. This may push the model to be more similar to a linear model. This is something we investigate with qualitative and quantitative analysis in Section 4.
3.2 Differentiability
On the note of differentiability, the ranking function 𝑅 is not differentiable. We substitute a soft ranking function from the torchsort package [3]. This provides a floating point approximation of the ordering of a vector rather than an exact integer computation of the ordering of a vector, which allows for differentiation
4 THE EFFICACY OF CONSENSUS TRAINING
In this section we present each experiment with the hypothesis it is designed to test. The datasets we use for our experiments are Bank Marketing, California Housing, and Electricity, three binary classification datasets available on the OpenML database [39]. For each dataset, we use a linear model’s performance (logistic regression) as a lower bound of realistic performance because linear models are considered inherently explainable.
\ The models we train to study the impact of our consensus loss term are multilayer perceptrons (MLPs). While the field of tabular deep learning is still growing, and MLPs may be an unlikely choice for most data scientists on tabular data, deep networks provide the flexibility to adapt training loops for multiple objectives [1, 10, 17, 28, 31, 35]. We also verify that our MLPs outperform linear models on each dataset, because if deep models trained to reach consensus are less accurate than a linear model, we would be better off using the linear model.
\ We include XGBoost [6] as a point of comparison for our approach, as it has become a widely popular method with high performance and strong consensus metrics on many tabular datasets (figures in Appendix A.7). There are cases where we achieve more explainer consensus than XGBoost, but this point is tangential as we are invested in exploring a loss for training neural networks.
\ For further details on our datasets and model training hyperparameters, see Appendices A.1 and A.2.
\
:::info Authors:
(1) Avi Schwarzschild, University of Maryland, College Park, Maryland, USA and Work completed while working at Arthur (avi1umd.edu);
(2) Max Cembalest, Arthur, New York City, New York, USA;
(3) Karthik Rao, Arthur, New York City, New York, USA;
(4) Keegan Hines, Arthur, New York City, New York, USA;
(5) John Dickerson†, Arthur, New York City, New York, USA (john@arthur.ai).
:::
:::info This paper is available on arxiv under CC BY 4.0 DEED license.
:::
[2] The PEAR package will be publicly for download on the Package Installer for Python (pip), and it is also available upon request from the authors.
\ [3] When more than one of the entries have the same magnitude, they get a common ranking value equal to the average rank if they were ordered arbitrarily.
You May Also Like

Is Doge Losing Steam As Traders Choose Pepeto For The Best Crypto Investment?

PBOC sets USD/CNY reference rate at 6.9590 vs. 6.9570 previous