

Crude Oil Futures Chart: How to Read the Energy Market
If you want to trade global energy, the crude oil futures chart is your most important tool. It is not just a picture of past prices. It is a live map of human psychology, supply, and demand.
Many beginners look at a trading chart and feel confused by the green and red bars. In this guide, I will explain exactly how to read a crude oil futures chart. I will also show you how to spot macro trends and execute trades using MEXC.
The Anatomy of a Candlestick
Most professional traders use a "candlestick" chart (or K-line chart) to track oil prices. Each candlestick shows you the price action for a specific time period, like one hour or one day.
Every single candlestick gives you four critical pieces of data, known as OHLC:
Open: The price when the time period started.
High: The highest price reached during that time.
Low: The lowest price dropped to during that time.
Close: The final price when the time period ended.
If the Close is higher than the Open, the candlestick is green (Bullish). Buyers won the battle. If the Close is lower than the Open, the candlestick is red (Bearish). Sellers pushed the price down.
WTI vs. Brent on the Chart
When you open an exchange, you will see different charts for different types of oil. You must choose the right chart for your strategy.
If you are trading US economic data, you should open the WTI chart. If you are trading Middle East news, you should open the Brent chart. To understand why these two charts move slightly differently during a crisis, read our guide on the difference between WTI and Brent.
Interactive Chart Reading Simulator
The best way to understand a crude oil futures chart is to interact with one. Use the educational simulator below to see how candlesticks form. You can trigger different macro events to see how the chart reacts in real time.
Hover over the candles to read the exact Open, High, Low, and Close data.
Why 24/7 Chart Access Matters
Traditional commodity markets close on Friday evening. They do not open again until Monday morning. This creates a massive problem.
If a war starts on Saturday, the oil price will gap up massively. Traditional traders cannot see this on their charts or protect their money until Monday. By then, it is too late.
This is why modern traders use synthetic derivatives. If you want to know how this works behind the scenes, read what are crypto crude oil futures. Because crypto exchanges never sleep, your WTI and Brent charts update 24 hours a day, 7 days a week. You can see the price action the exact second a news story breaks.
Execute Your Strategy on MEXC
Once you know how to read the chart, it is time to trade. If you are ready to learn how to trade crude oil with USDT, MEXC provides the ultimate platform.
Here is why you should trade oil on MEXC:
0% Trading Fees: Every time a candlestick closes, you can enter or exit a trade without paying high broker commissions.
200x Leverage: You can use a small amount of capital to catch big profits from minor chart breakouts.
Deep Liquidity: MEXC offers institutional-grade order books. This means your market orders execute instantly, exactly where you see the price on the chart.
Do not trade blindly. Learn the chart, manage your risk, and trade the global energy market with confidence. Log in to MEXC, open the USOIL or UKOIL chart, and start catching the next big macro trend today.
Popular Articles
View More
The Diamond Hands Crack: Why MicroStrategy Fell 25% After Forcing Its First Bitcoin Sale
The defining narrative of the corporate Bitcoin standard has officially shifted from aggressive accumulation to operational survival. Strategy Inc. (formerly MicroStrategy, trading under the Nasdaq

GPT-5.6 vs Claude Fable 5: The Battle for Long-Horizon Agentic Autonomy
The frontier AI landscape has shifted from chatbots that provide static answers to autonomous, long-horizon agents capable of managing multi-step workflows over hours or days. At the absolute

AAVE Price Prediction July 2026: The $100 Million Launch That Just Changed Everything
AAVE sits at $88 today, and a major global bank just said it could be worth $3,500 in four years. That gap is exactly why an AAVE price prediction is worth reading in full instead of skimming for a
Hot Crypto Updates
View More
CASHCAT Becomes Robinhood Chain First Breakout Meme Coin to Top 100 Million Market Cap
Overview Robinhood spent a year paving the way for its own blockchain, pitching tokenized US stocks as the serious narrative, yet the first asset to truly break out on the new chain is a cartoon cat

Paul Atkins-Led SEC Proposes Rules to Let Crypto Trade Alongside Stocks on Exchanges: What It Means for Investors
Overview The U.S. Securities and Exchange Commission is advancing a set of rules that could reshape American trading infrastructure by letting non-security crypto assets, tokenized securities, and

MiCA Enforcement Arrives: USDT Off EU Venues, Unlicensed Exchanges Orphaned, and How to Trade the Eurozone Liquidity Split
Overview The Markets in Crypto-Assets regulation reached full enforcement across all 27 EU member states on July 1, 2026, when the transitional grandfathering window closed with no extension. ESMA

Trending News
View More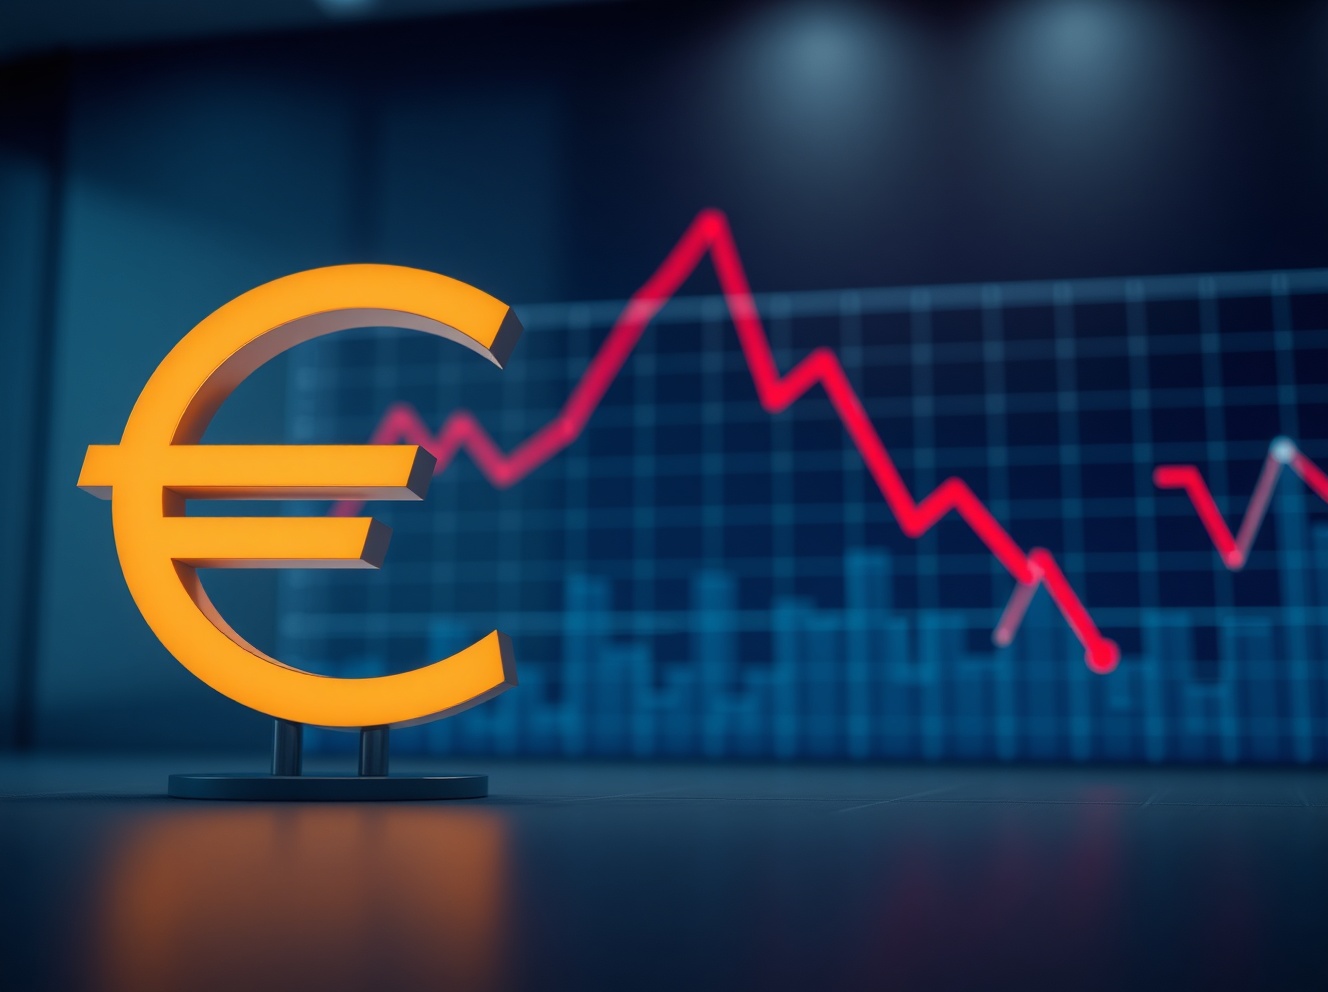
EUR/USD Wavers Around 1.1430 as Bearish Trend Remains Intact
BitcoinWorld EUR/USD Wavers Around 1.1430 as Bearish Trend Remains Intact The EUR/USD currency pair continues to trade near the 1.1430 level, showing signs of

Financials, Healthcare and Staples: The S&P 500 Rotation Trade Beyond Mega-Cap Tech
June’s 0.7% S&P 500 dip and 2.4% equal-weight gain flagged rotation. Financials, healthcare, staples drew fresh inflows as mega-cap tech cooled in June.


Related Articles
View More
Brent Crude Hovers Near $78: Strait of Hormuz Bottlenecks Clash With Macro Demand Resets
Global energy benchmarks are locked in an intense structural tug-of-war following an explosive breakdown of Middle East diplomatic agreements. After bottoming near multi-month consolidation bases earl

Hormuz Truce Shattered: US and Iran Exchange Fiercest Airstrikes as Trump Declares Ceasefire "Over"
The fragile geopolitical equilibrium in the Persian Gulf has collapsed into a severe multi-front military escalation. On July 9, 2026, the United States and Iran exchanged their most intense barrages
Rebranding to Re-rating: Why Penguin Solutions (PENG) Skyrocketed 50% Post-AI Earnings Beat
While global institutional capital spent early July liquidating mega-cap memory and hardware clusters on oversupply worries, a profound mid-cap anomaly emerged on the Nasdaq. Penguin Solutions Inc. (t


