XRP Price Prediction: XRP ETF Flows Quiet, Then Negative - What's Next
XRP trades near $1.11 as ETF demand cools off
$XRP is changing hands around $1.1088 at the time of writing. The token is up 0.93% on the day, but the move has come with some hesitation.
This XRP price prediction looks at fresh ETF data, a key chart pattern, and liquidation levels to map out where XRP could head next.
Trading volume over the past 24 hours sits near $1.03M to $1.33M across major pairs. That is not a huge number, and it lines up with a broader slowdown in demand this week.
Why did spot ETF inflows turn negative?
As per SoSOValue Data, Spot XRP ETFs just posted their weakest day since March. On July 8, 2026, Ripple-linked ETF products saw a net outflow of $7.29 million.
That single day wiped out momentum that had been building. The fund group is now down $2.66 million for the month of July 2026.
Here is how the last week of flows looked:
|
Date |
Daily Net Inflow |
Cumulative Net Inflow |
Total Value Traded |
Total Net Assets |
|
Jul 9, 2026 |
$0.00 |
$1.48B |
$6.87M |
$989.46M |
|
Jul 8, 2026 |
-$7.29M |
$1.48B |
$12.59M |
$983.40M |
|
Jul 7, 2026 |
$0.00 |
$1.49B |
$12.16M |
$1.02B |
|
Jul 6, 2026 |
$0.00 |
$1.49B |
$14.46M |
$1.05B |
|
Jul 2, 2026 |
$6.55M |
$1.49B |
$12.74M |
$987.91M |
|
Jul 1, 2026 |
-$1.86M |
$1.40B |
$14.05M |
$960.61M |
Two straight days of zero flow, followed by a sharp outflow, is not a great sign. It shows buyers stepped back right when the altcoin needed fresh demand.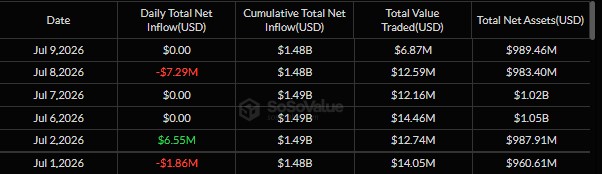
What does the XRP chart pattern suggest?
Chart watcher Ali Charts flagged a possible bearish flag forming on the 1-hour chart. If the pattern plays out, the next target could be $1.04.
The chart shows the altcoin dropping from around $1.14 down toward $1.08, then consolidating in a tight triangle near $1.096. A break below that triangle could send price toward the flag target.
This kind of setup is common after a sharp drop. Price often pauses, forms a small range, then continues in the direction of the original move.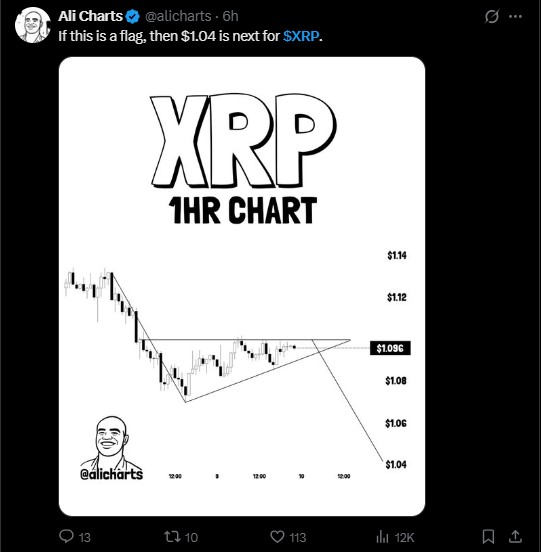
Where is the key support level?
According to URPD data, $1.06 is the floor that matters most right now.
If the altcoin holds above $1.06, the daily buy signal stays valid. That could open the door to a rebound toward $1.27 and then $1.35.
If the altcoin closes a full day below $1.06, the setup changes. A deeper flush toward $0.80, $0.62, or even $0.51 becomes possible.
Neither outcome is guaranteed. XRP price prediction models built on support and resistance are only as good as the levels holding up in real time.
What do XRP futures and liquidation data show?
Futures data paints a mixed picture. The futures volume is down 33.19% to $1.34B, and open interest slipped 0.70% to $2.34B.
Long and short liquidations tell an interesting story. Over the past 24 hours, shorts got hit harder, losing $658.21K compared to $365.20K in long liquidations.
The liquidation heatmap shows heavy long liquidation pressure clustered between $1.04 and $1.09, an area already passed through.
On the upside, short liquidation clusters sit between $1.11 and $1.22, meaning a push higher could trigger short covering.
Binance data shows more accounts holding long positions than short, with a long/short ratio near 2.72. That suggests retail traders are still leaning bullish even after the pullback.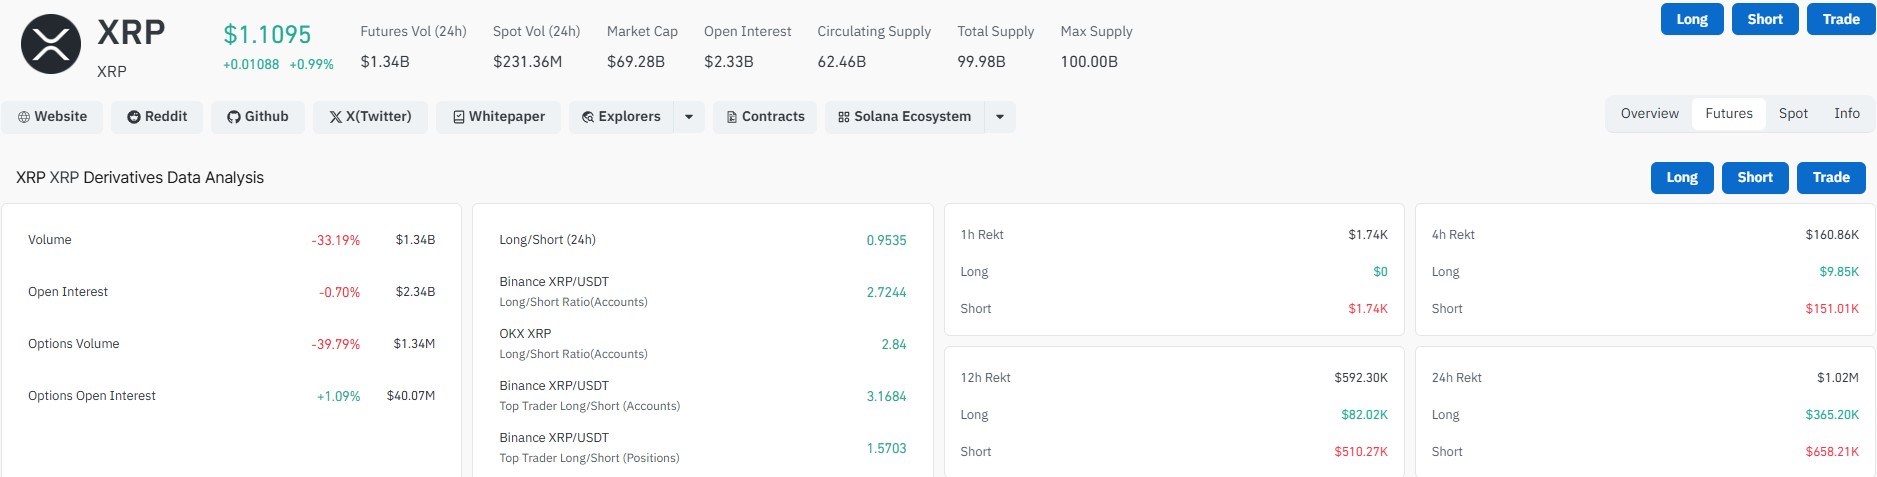
Is there a longer-term case for XRP?
Beyond the charts, there is a structural argument some analysts point to. The XRP Ledger has reportedly crossed 1 million agentic payments through the X402 protocol.
Supporters see this as a sign the network is being used for real payment automation, not just speculation. Whether that translates into near-term price strength is a separate question from daily chart patterns.
Short-term traders are watching $1.06 and $1.04. Longer-term holders are watching network usage and ETF flow trends over weeks, not days.
XRP Price Prediction: Key levels to watch
|
Level Type |
Price |
What It Means |
|
Immediate resistance |
$1.12 |
Recent intraday high |
|
Support to hold |
$1.06 |
Buy signal validity line |
|
Bearish flag target |
$1.04 |
If pattern completes |
|
Upside target 1 |
$1.27 |
If $1.06 holds |
|
Upside target 2 |
$1.35 |
Extended rebound target |
|
Downside target 1 |
$0.80 |
If $1.06 breaks |
|
Downside target 2 |
$0.62 |
Deeper flush scenario |
|
Downside target 3 |
$0.51 |
Worst-case flush scenario |
Disclaimer
This article is for informational purposes only and does not constitute financial advice. Cryptocurrency markets are volatile and unpredictable. Always do your own research and consult a licensed financial advisor before making investment decisions. Past performance and technical patterns do not guarantee future results.


추천 콘텐츠

Metaplanet buys 5,075 Bitcoin in Q1 to become 3rd-largest treasury

The changing face of elder care in Malaysia — Sayed Mohammad Reza Yamani Sayed Umar

Covéa Chooses Shift Technology as Strategic Partner for Fraud and Risk Management


인기 뉴스
더보기