

Ethereum (ETH) Bears Pressure the $1,100 Support: Can Buyers Defend It?
- Ethereum is holding at the $1.6K zone.
- The bullish momentum of ETH is strengthening.
Ethereum is again approaching a price zone that has repeatedly shaped its long-term market structure. The $1,100 level has served as the lower boundary of ETH’s macro trading channel since 2021, making it one of the crucial support levels among long-term market participants.
Historically, each revisit to this area has been followed by strong buying interest. While past performance does not guarantee future results, the level has consistently acted as a foundation for broader market recoveries over the past several years.
If Ethereum defends the $1,100 support, the broader channel structure outlines two key price objectives. The first lies around $3,000, which shows the midpoint of the long-term channel. This level could become a logical zone for investors to partially realise gains.
Furthermore, the upper boundary of the channel sits near $5,000. This region aligns closely with ETH’s previous cycle highs and would represent a full recovery within the existing macro trend if market conditions remain supportive.
Although the technical setup highlights a favourable risk-to-reward profile from a charting perspective, Ethereum’s next move will also depend on broader market sentiment, macroeconomic conditions, and sustained demand. A significant defence could reinforce confidence in the asset’s long-term outlook.
What is Ethereum’s Trading Chart Structure Points To?
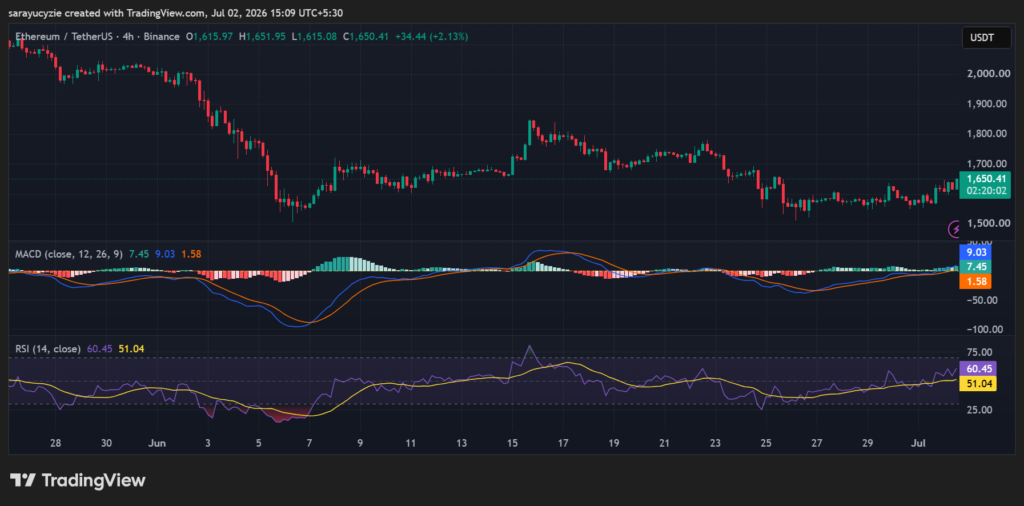
The current ETH trajectory is trying to flip the momentum green. At press time, it is trading at $1,619 after gaining a modest 2.45%. The price is holding above the daily low at around $1,564, and its highest trading point is noted at $1,642. Moreover, the daily trading volume is sitting at $11.40 billion.
Notably, with the recent trading pattern, the initial support might be found at $1,562. Further downside correction of ETH likely triggers a move below $1.5K. On the upside, Ethereum bulls would climb to the nearest $1,672 resistance level. A stronger push toward the $1.7K mark exhibits stronger momentum.
ETH’s Moving Average Convergence Divergence (MACD) line is over the signal line, and both are above the zero line. It indicates that the bullish momentum is strengthening, and the buyers have regained control. With the indicator positioning, the current upward momentum is likely to remain intact.
 (Source: TradingView)
The daily Relative Strength Index (RSI) value is around 60.45, suggesting healthy bullish momentum without entering overbought territory. There is still room for the price to move higher. Also, this supports the ongoing recovery attempts while leaving scope for further gains if buying interest continues.
Crypto Market Highlights
Solana Expands Validator Power With Launch of On-Chain Governance


추천 콘텐츠

Brazil vs Norway Tactical Preview: How Brazil Can Stop Haaland and Ødegaard

Best Crypto to Buy Now as Fed Eases Inflation Fears, ETFs Reverse Course, and Pepeto Could Deliver the Returns That Change Everything

Hamster Kombat Daily Combo 5 July 2026: Play To Earn


인기 뉴스
더보기
