

XRP price forms multi-month falling wedge near $1 support as liquidations mount
XRP has fallen to its lowest level in months after a sharp selloff driven by a major derivatives flush and fresh pressure across the crypto market, while technical charts now show the token testing the lower boundary of a long-term falling wedge.
- XRP has fallen toward the key $1 support after a $10.8 billion crypto options expiry triggered heavy market-wide selling.
- A multi-month falling wedge and oversold momentum indicators suggest the token is nearing a critical technical inflection point.
- Analysts warn a break below $1 could expose lower support zones, while reclaiming $1.10 would improve the bullish outlook.
According to data from crypto.news price, XRP (XRP) price dropped from around $1.07 on June 25 to $1.01 on June 26, extending its year-to-date decline to more than 40%. The decline accelerated as a $10.8 billion crypto options expiry triggered heavy volatility across digital assets and forced a wave of long liquidations.
At the same time, sentiment surrounding the XRP ecosystem weakened after decentralized finance protocol Strobe Finance abruptly announced it would shut down operations.
The selling pressure arrived as investors also reduced exposure to risk assets following stronger expectations that the U.S. Federal Reserve could keep interest rates higher for longer. Bitcoin’s slide below the $60,000 level removed another layer of support for altcoins, leaving XRP among the weaker large-cap tokens during Thursday’s session.
XRP approaches long-term support as liquidation clusters build overhead
The daily chart shows XRP trading at the lower edge of a falling wedge that has contained price action for almost a year. The pattern has compressed between descending resistance and gradually declining support, with the token now sitting close to the wedge’s lower boundary near $1.00.
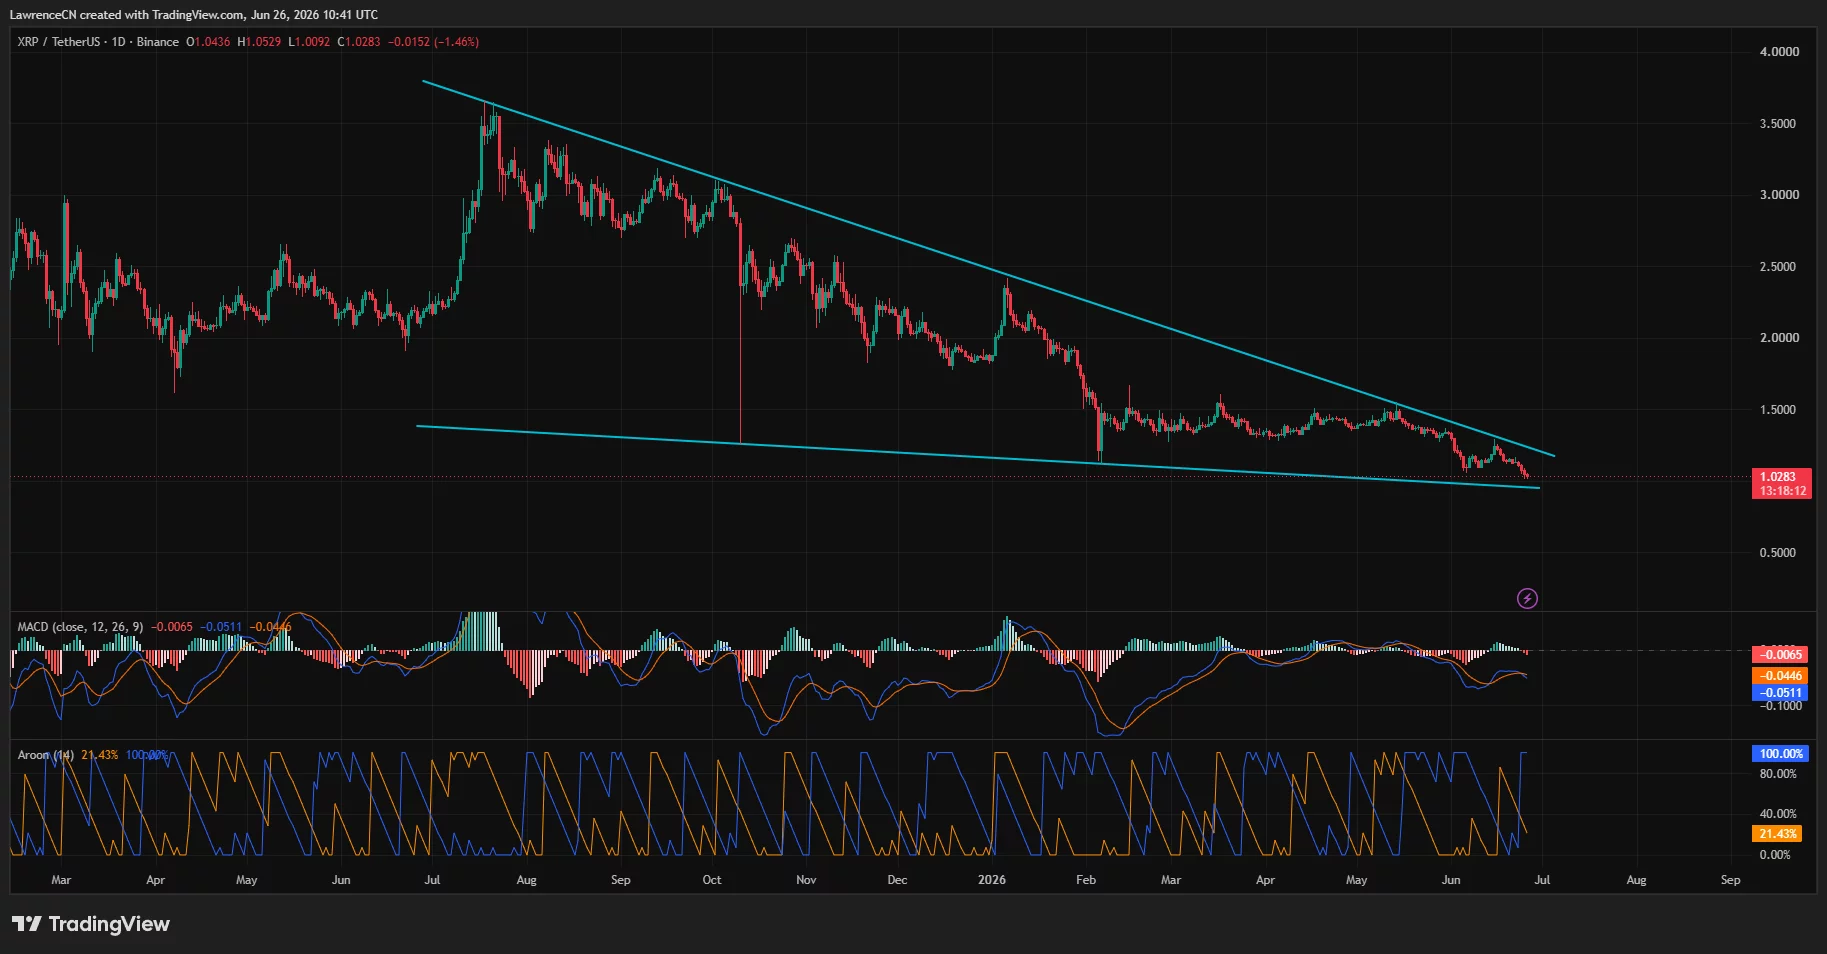
Momentum indicators remain weak. The MACD has stayed below its signal line with histogram bars still in negative territory, while the Aroon indicator continues to favor sellers after Aroon Down climbed back toward 100 and Aroon Up remained subdued. Together, the indicators suggest bears still control the short-term trend even as XRP price approaches a historically important support zone.
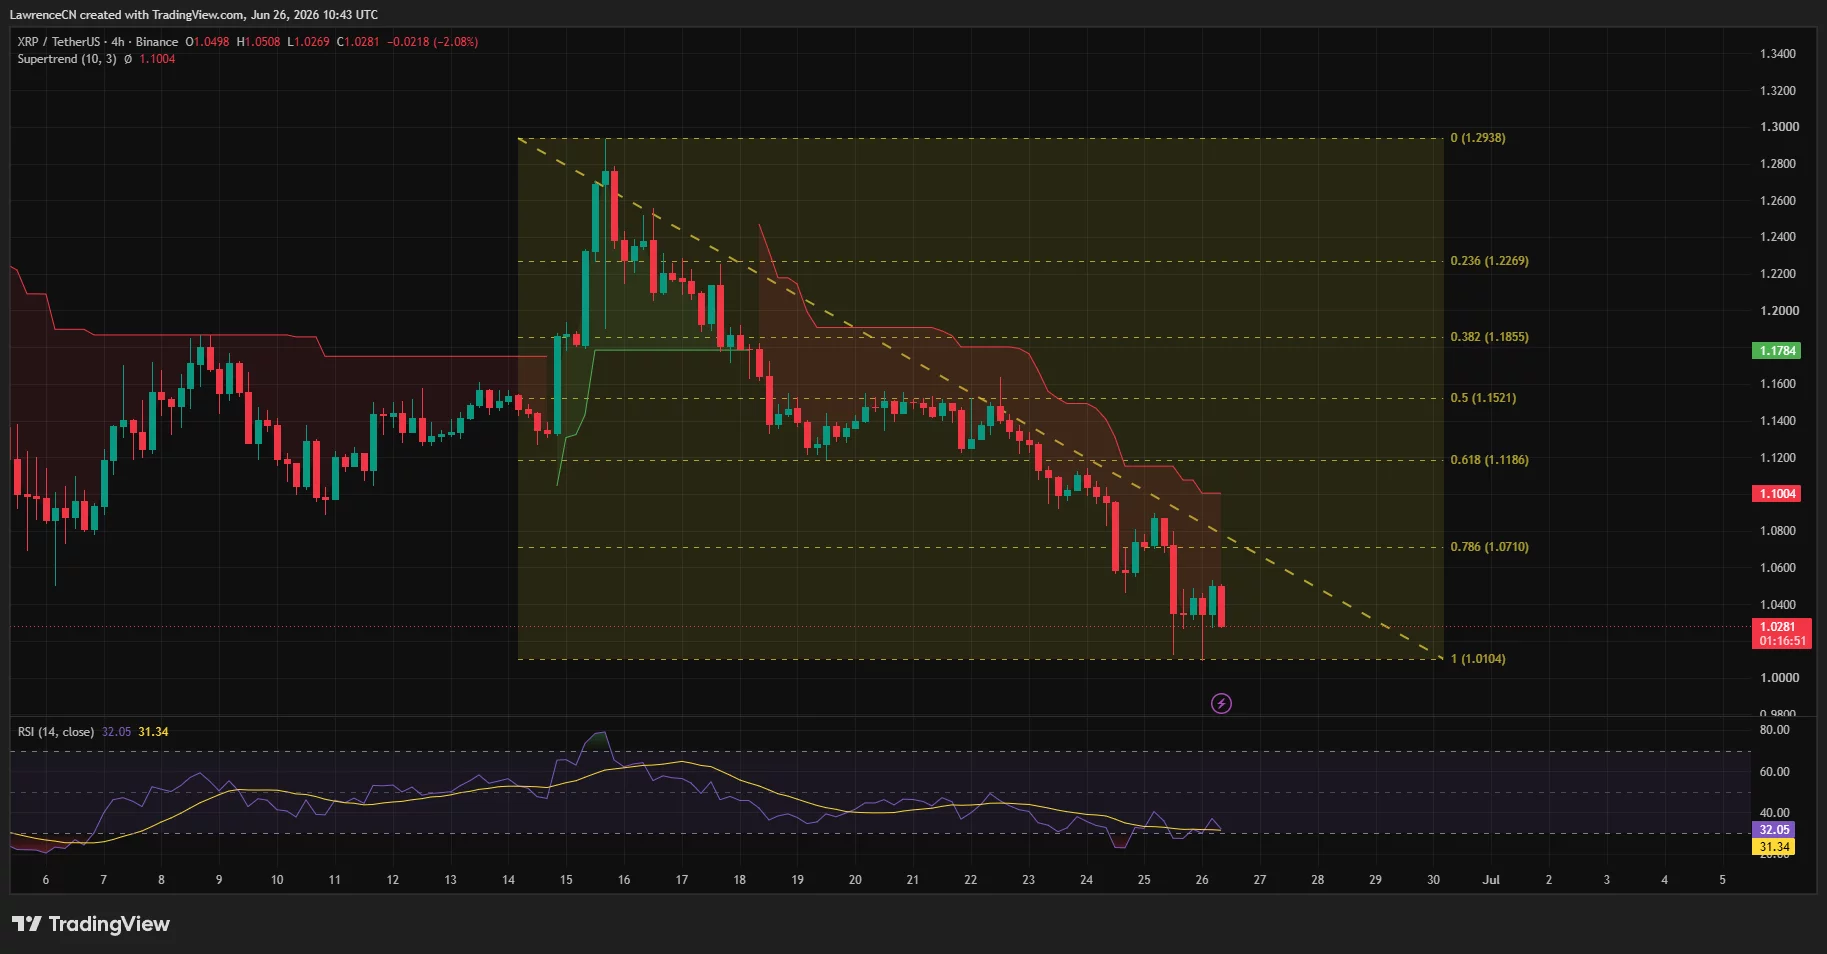
The four-hour chart presents another important technical level. XRP has retraced almost the entire advance measured by the displayed Fibonacci range and now trades just above the 100% retracement near $1.01. Price also remains below the Supertrend resistance around $1.10, while the RSI has slipped to nearly 31, placing momentum close to oversold territory but without confirming a bullish reversal.
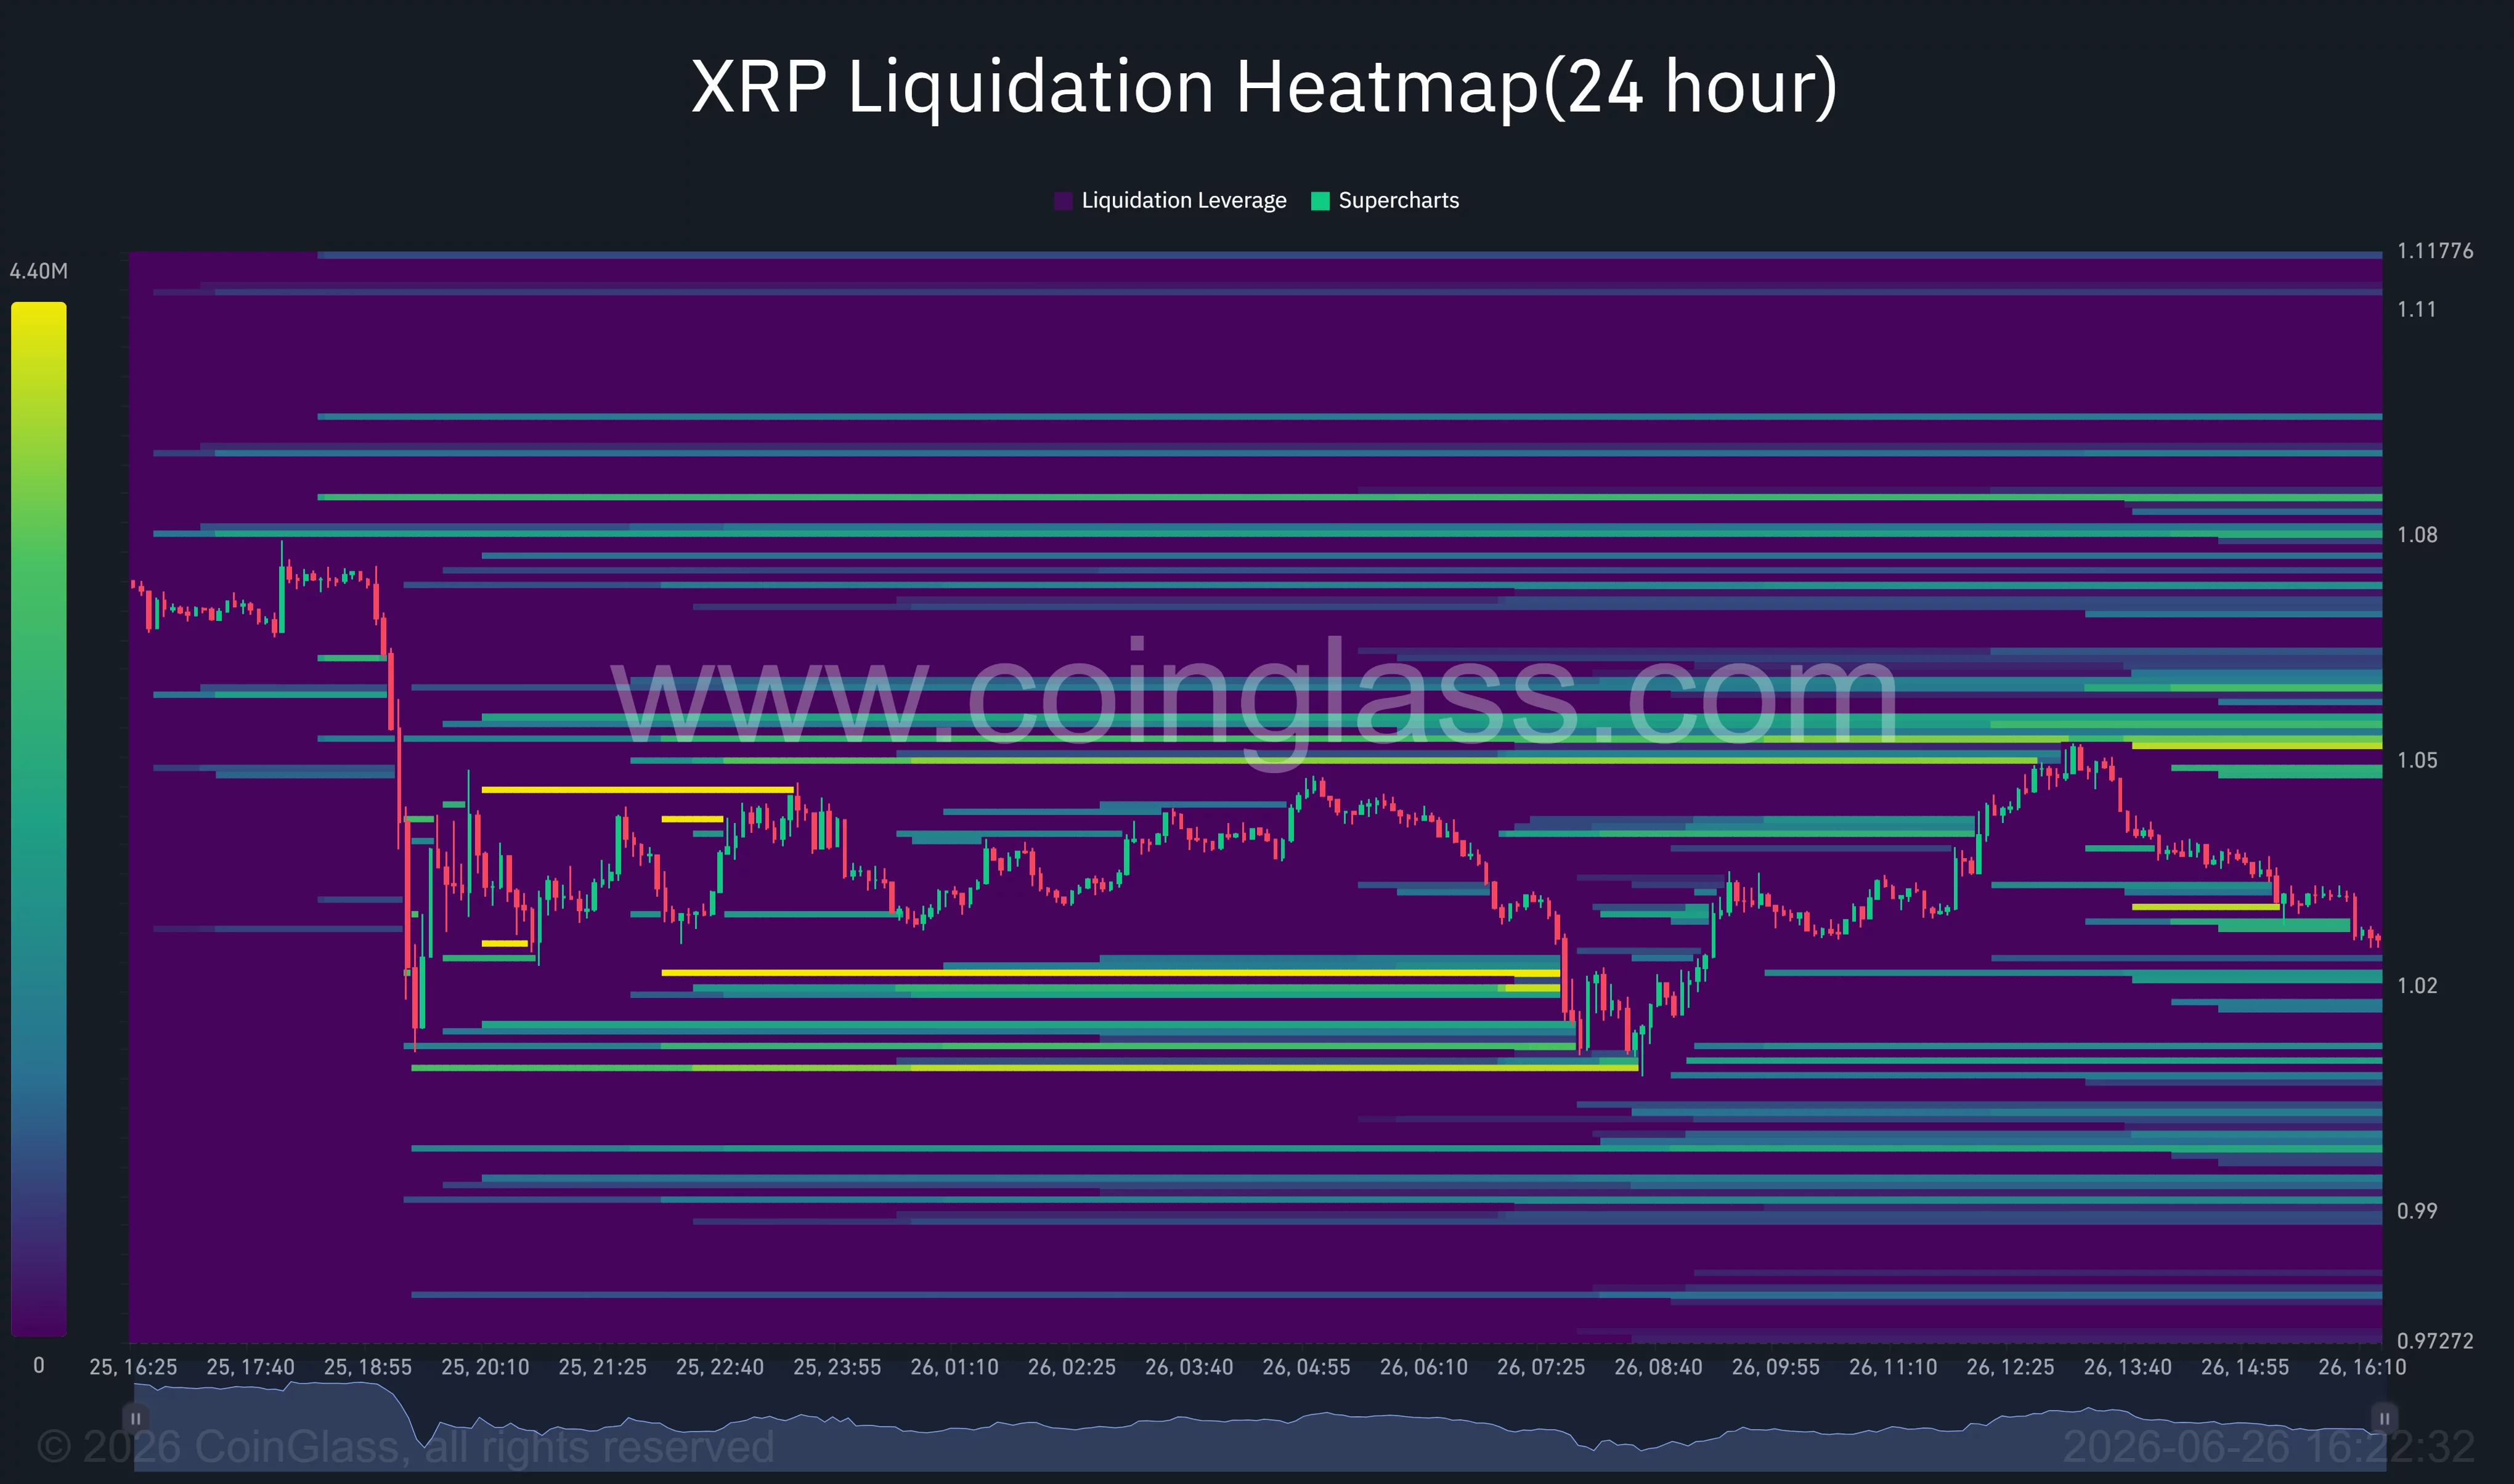
Derivatives positioning also highlights where volatility could increase next. CoinGlass liquidation heatmap data show large concentrations of leveraged positions clustered between roughly $1.05 and $1.08, while another sizable liquidity pocket sits around the $1.02 area. Those zones could attract price in either direction as traders compete for liquidity, increasing the likelihood of sharp short-term swings.
On-chain positioning has also drawn attention to nearby support. According to well-followed analyst Ali Martinez, UTXO Realized Price Distribution data identify $1.06 as a major accumulation level where more than 830 million XRP previously changed hands.
Bears retain control while lower demand zones come into focus
Several downside risks could still invalidate any recovery attempt. A sustained move below the wedge support around $1.00 would break one of XRP’s longest-running chart structures and could expose lower historical demand zones identified by both technical and on-chain data.
Commenting on the latest structure, crypto analyst ChartNerd noted that XRP has entered an area of interest after weeks of decline but warned that losing the current support would shift attention toward the $0.90-$0.70 range, where previous buying activity was concentrated.
Any recovery will also depend on conditions outside the XRP market. Additional institutional outflows from crypto investment products, another round of heavy derivatives liquidations, or stronger-than-expected U.S. economic data that reinforce expectations for restrictive Federal Reserve policy could extend pressure across digital assets.
Conversely, reclaiming the $1.10 region and breaking above the falling wedge resistance would be the first technical signal that buyers are regaining control.
Disclosure: This article does not represent investment advice. The content and materials featured on this page are for educational purposes only.


추천 콘텐츠

Not a loophole: Singapore AI export controls let China tap US AI legally

Best Mobile User Retention Tools in 2026
Critical USDT0 Response to Drift Hack Exposes Stark Contrast in Stablecoin Security Protocols


인기 뉴스
더보기
