

Bitcoin Drops to $60K, Triggers $530M Demand Zone—Can Bulls Rebuy?
Bitcoin has pulled back sharply, losing around 3% over the past 24 hours and trading into a heavy bid-liquidity pocket after dipping below $61,000. Traders are now watching how price responds around the $60,500–$61,500 band, where large amounts of buy-side liquidity appear to be positioned to absorb selling.
Order book and liquidation data suggest that the short-term direction may hinge on where leverage has already been cleared and where fresh liquidation clusters remain. With momentum weakening under key levels, the next test of liquidity could determine whether BTC finds support or slides toward higher-risk areas.
Key takeaways
- BTC slipped under $61,000 and is moving into a dense buy-liquidity zone between $60,500 and $61,500, linked to more than $525 million in initial bids.
- Recent price action weakened momentum after BTC closed at $62,700 on Tuesday, its lowest daily close since June 10, and lost support at $63,000.
- Velo data shows traders added 8,366 BTC in bids between $61,500 and $60,500, with about $270 million of buy orders reportedly triggered after the break below $61,000.
- CoinGlass indicates liquidation dynamics have shifted: more than $125 million in long positions were liquidated in the last hour, while substantial short leverage remains above spot price near $63,500 and $65,000.
Bitcoin momentum fades after $63,000 rejection
According to the market snapshot cited in the report, BTC closed at $62,700 on Tuesday, marking its lowest daily close since June 10. The decline also produced a bearish engulfing pattern against Monday’s range, a technical signal traders often interpret as short-term momentum turning weaker and follow-through risk increasing.
Following that close, price consolidated beneath $63,000 after failing to hold the level as support. On the one-hour chart, the report notes a sequence of lower highs after rejection near $66,000 earlier this week. The relative strength index (RSI) has also cooled from recent overbought levels, aligning with a more cautious near-term trading posture.
While the downward pressure has been visible, the analysis still frames the market as range-bound in the bigger picture: BTC is trading above the June range low near $60,500. For traders, that means the immediate “tell” is whether the market can defend that lower boundary or whether the current liquidity stack gets fully worked through.
Trader cautions: wait for the lower-liquidity test
In a recent market update on X (formerly Twitter), crypto trader Lennaert Snyder urged caution, saying he was not yet ready to buy despite a bounce attempt. Snyder’s view, as quoted in the report, was that BTC might need to test the lower liquidity first before long exposure makes sense.
Snyder highlighted $61,500 and $60,500 as the primary levels to watch for bullish reactions. On the upside, he pointed to $63,500 and $64,000 as potential zones where liquidity could attract price before another potential move downward. The implication is that traders may need confirmation—either a clear reaction at the bids or evidence that upside liquidity is drawing price—rather than assuming support will automatically hold.
How the buy-side liquidity cluster is shaping the move
The report attributes BTC’s near-term reaction to an identifiable order-book structure: large buy bids clustered just below the $61,000 threshold. It cites Velo data showing traders initially added 8,366 BTC to bid liquidity between $61,500 and $60,500, totaling more than $525 million in stacked bids across that band.
As BTC pushed through part of that range, the report states that around $270 million worth of buy orders were triggered when price dropped below $61,000. Even after that flush, bids remain concentrated toward the lower end of the cluster, where traders appear to be attempting to absorb new selling pressure.
This matters because dense bid liquidity can act like a “magnet” during volatile conditions: instead of price smoothly trending, it often pauses and oscillates while large limit orders are consumed and replenished. The key question now is whether the bids between $60,500 and $61,000 can continue absorbing selling, or whether they are being used up faster than new support is added.
Liquidation data: long leverage cleared, short risk rising
Beyond order book liquidity, the report leans on liquidation mapping to explain how leverage may be influencing short-term price action. It notes that the move below $61,000 flushed a meaningful portion of leveraged long positions clustered around $61,500.
CoinGlass data referenced in the report shows more than $125 million in long liquidations over the past hour. With much of the nearby long-side leverage reportedly cleared out, the liquidation map shifts toward shorts positioned above the current price.
The report claims that more than $1.2 billion in short positions sit near $63,500, with the next major pocket of liquidation risk located around $65,000, where more than $2.4 billion in short positions are said to be vulnerable. In many liquidation-driven markets, such setups can create sharp, fast moves when price reaches the levels where forced buying or selling cascades begin.
For now, the analysis suggests the most important liquidity concentrations are still anchored around $60,500, where both spot demand and leveraged exposure are heavily stacked. If downside liquidation becomes less concentrated after the latest flush, traders may be more willing to watch how quickly price can re-attract the short-liquidity layers above.
What to watch next
Traders should monitor whether BTC can stabilize and bounce from the remaining bids near $60,500–$61,000—or whether the market works through that stack and draws in the larger liquidation pools above $63,500 and $65,000. The next few sessions will likely reveal whether today’s drop was primarily a liquidity sweep or the start of a broader breakdown.
This article was originally published as Bitcoin Drops to $60K, Triggers $530M Demand Zone—Can Bulls Rebuy? on Crypto Breaking News – your trusted source for crypto news, Bitcoin news, and blockchain updates.


추천 콘텐츠

Kaspa Gained 10.02% in Last Month and is Predicted to Drop to $0.028204 By Apr 06, 2026
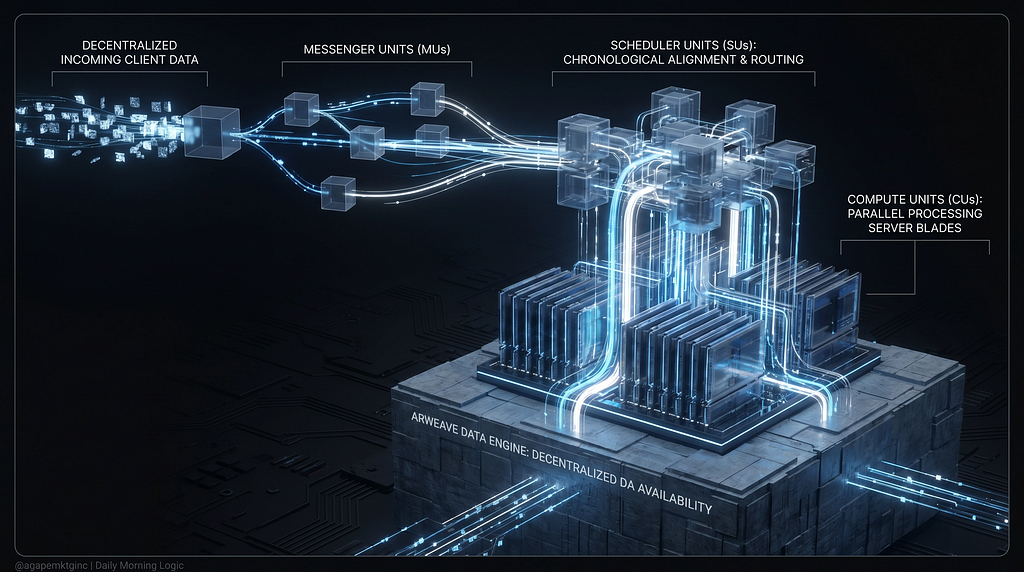
The Asymmetric Architecture of Arweave ($AR) and the AO Computing Layer

T1 Energy (TE) Stock; Sinks 19% With Warrants Deep Underwater Before July 9 Expiry


인기 뉴스
더보기
