

Solana (SOL) Struggles Below $72 as Bearish Momentum Builds Despite ETF Gains
Key Highlights
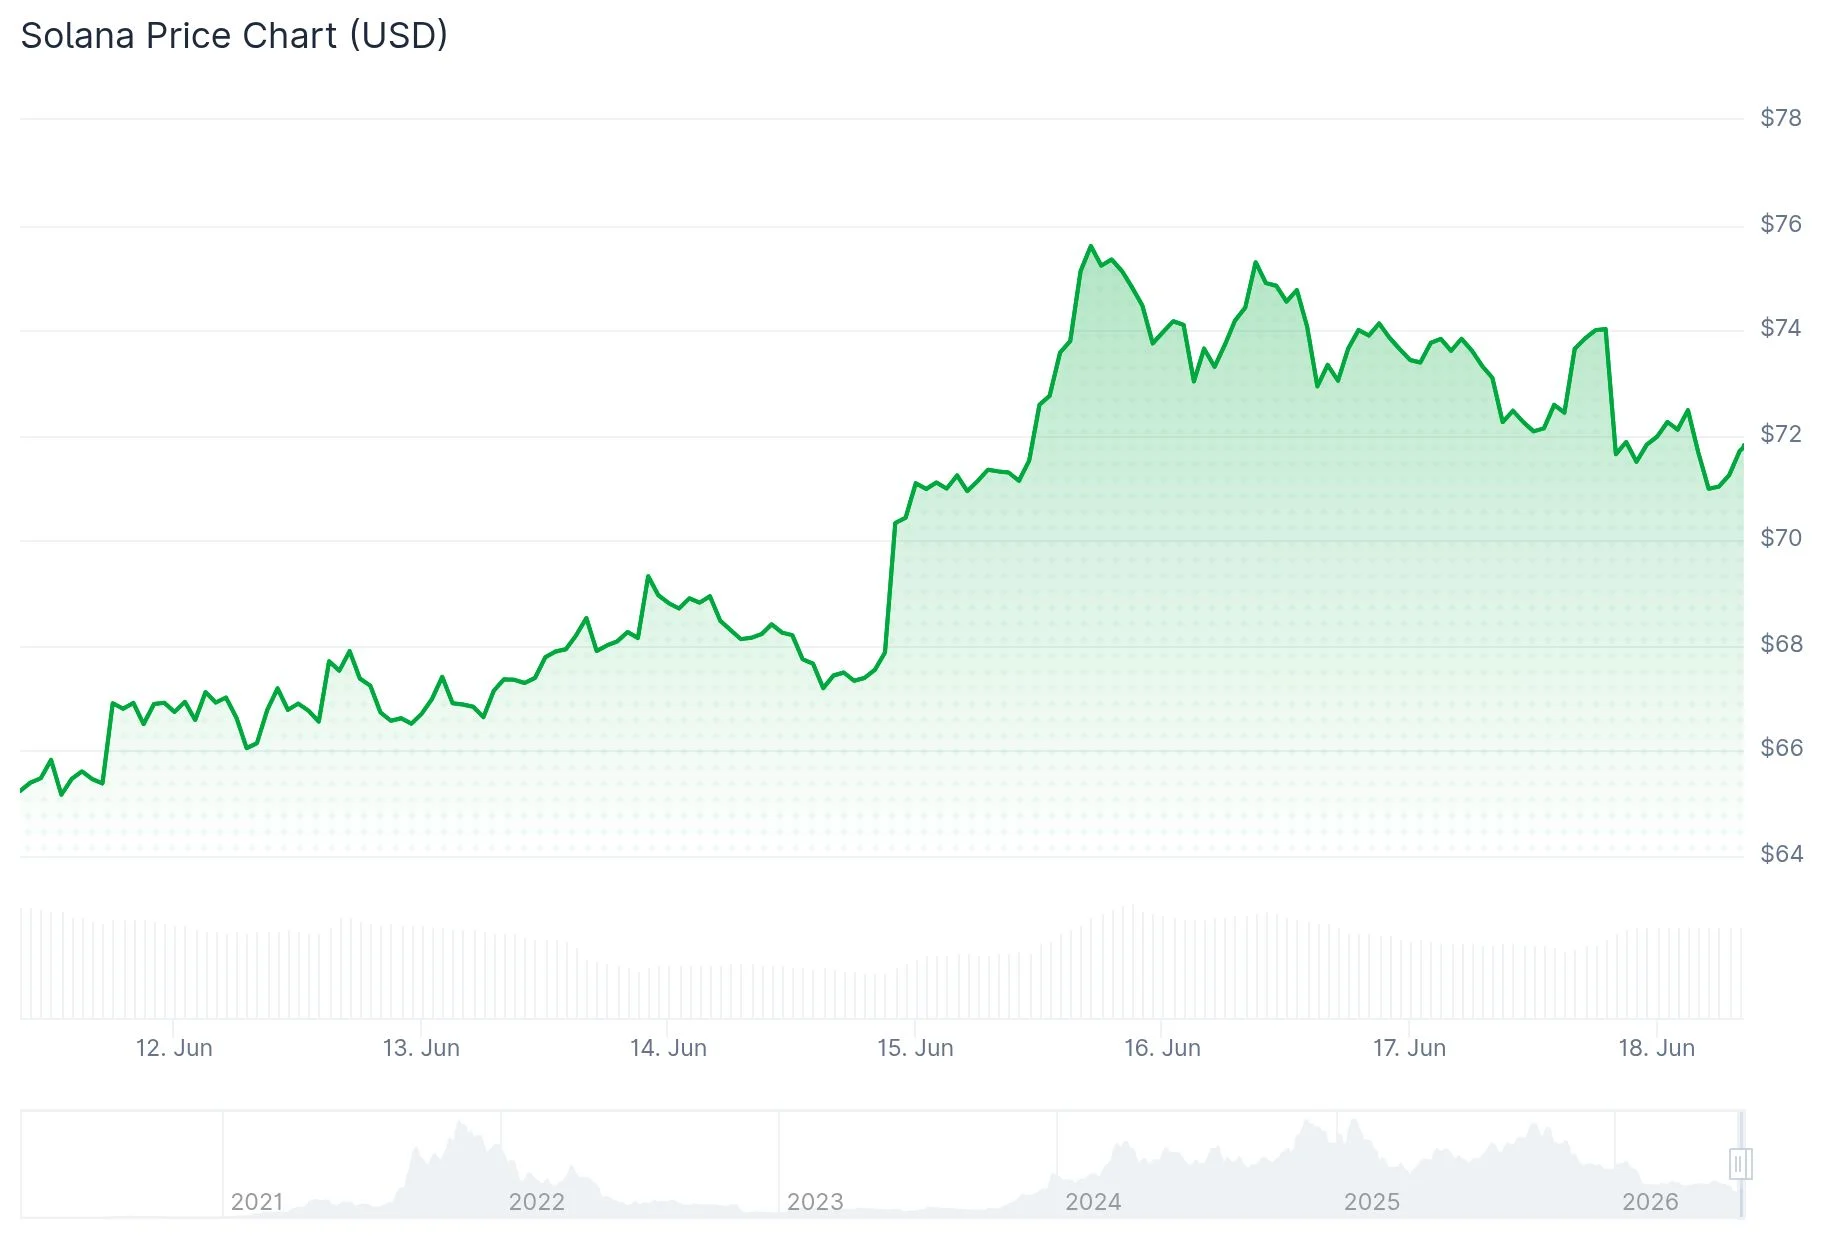
- SOL has dropped beneath the $72 threshold, shedding more than 2.5% across the previous 48 hours.
- On Wednesday, spot ETFs attracted $1.06 million in net inflows, extending a three-day streak of positive movement.
- The current long-to-short ratio stands at 0.91, indicating heightened bearish positioning among traders.
- Funding rates have shifted into negative territory, with short holders compensating long positions—a classic bearish indicator.
- Technical analyst BATMAN highlighted that a former support zone has now converted into resistance, while the Stochastic oscillator signals overbought conditions.
Solana (SOL) continues its downward trajectory, hovering near $71 in Thursday’s trading session. The cryptocurrency has surrendered over 2.5% of its value during the past two days, remaining firmly suppressed below critical moving average benchmarks.
 Solana (SOL) Price
While price action remains subdued, institutional investment offers a glimmer of positivity. Solana spot ETF products registered $1.06 million in net capital inflows on Wednesday, per SoSoValue tracking data. This achievement represents the third successive session of capital accumulation this week.
Yet, these ETF gains haven’t translated into upward price momentum. Derivatives market indicators continue signaling bearish sentiment across the board.
According to CoinGlass metrics, SOL’s long-to-short ratio registered 0.91 on Thursday. When this metric falls below the 1.0 threshold, it reveals that short positions outnumber long positions—indicating prevailing pessimism. This represents one of the lowest readings observed over the past 30-day period.
Funding rates have also crossed into negative territory since Tuesday, currently sitting at -0.0036% on Thursday. When funding rates go negative, it means short position holders are compensating long position holders—a clear indication that pessimistic wagers are controlling market dynamics.
Technical Analyst Identifies Critical Resistance Conversion
On June 17, cryptocurrency analyst BATMAN published a technical assessment cautioning that SOL has encountered rejection at a price level that previously functioned as support but has now transformed into resistance. Such support-to-resistance conversions typically represent bearish developments in chart analysis.
BATMAN further observed that the Stochastic momentum indicator has entered overbought territory—mirroring conditions that preceded the most recent significant price peak. These technical signals point toward potential continued downward momentum unless substantial buying pressure emerges.
Broadening the perspective, SOL is currently positioned beneath its 50-day, 100-day, and 200-day Exponential Moving Averages (EMAs). All three trend indicators remain significantly elevated above current price levels, reinforcing the bearish structural framework.
Market analyst Daan Crypto Trades (@DaanCrypto) observed on June 16 that SOL appeared to be attempting an escape from a descending wedge formation relative to Bitcoin. He suggested that a confirmed breakout might propel SOL upward and energize related ecosystem tokens, though he cautioned that resistance remained formidable at that juncture and warranted continued monitoring.
Contrasting Technical Indicators
The Relative Strength Index (RSI) currently reads approximately 44 on the daily timeframe—marginally below the neutral 50 mark but showing recovery from previously oversold conditions. The MACD indicator has generated a bullish crossover signal, with the MACD line positioned at -2.80 crossing above the signal line at -4.09, while the histogram displays a positive reading of +1.29.
These technical signals indicate emerging buying interest, though market observers emphasize that substantially stronger momentum will be necessary to validate any genuine trend reversal.
Solana has bounced from the $60–$64 support zone that defined recent weeks. The asset now trades above the middle Bollinger Band positioned at $71.20, while the upper band resistance resides at $84.07.
Critical resistance barriers worth monitoring on the upside include $74.75 (corresponding to the 38.2% Fibonacci retracement level), $77.07, and $79.27. Immediate downside support is located around $69.16, with the recent cycle low positioned near $60.13 providing a deeper safety net.
As of the current trading session, SOL registers a 24-hour trading volume totaling $4.26 billion alongside a market capitalization of $42.56 billion, while experiencing a 24-hour price decline of 0.56%.
The post Solana (SOL) Struggles Below $72 as Bearish Momentum Builds Despite ETF Gains appeared first on Blockonomi.


추천 콘텐츠

RareSkills and Starknet Foundation Publish Free Advanced Developer Course for Starknet

Tron Inc increased its TRX holdings above 701.7 million with latest $50,000 purchase

From Telegram to Terminal: Banana Gun’s Pro Platform Hits Ethereum as User Base Surpasses One Million


인기 뉴스
더보기
