

Ethereum Price Today: $830 Gap From 200-Day EMA Signals Deep Trouble

As of June 26, 2026, ETH trades near $1,549 against USDT — a level signaling genuine market distress. The Ethereum price today reflects a structure where sellers remain firmly in control, with the Fear & Greed Index collapsed to 13 in Extreme Fear territory.
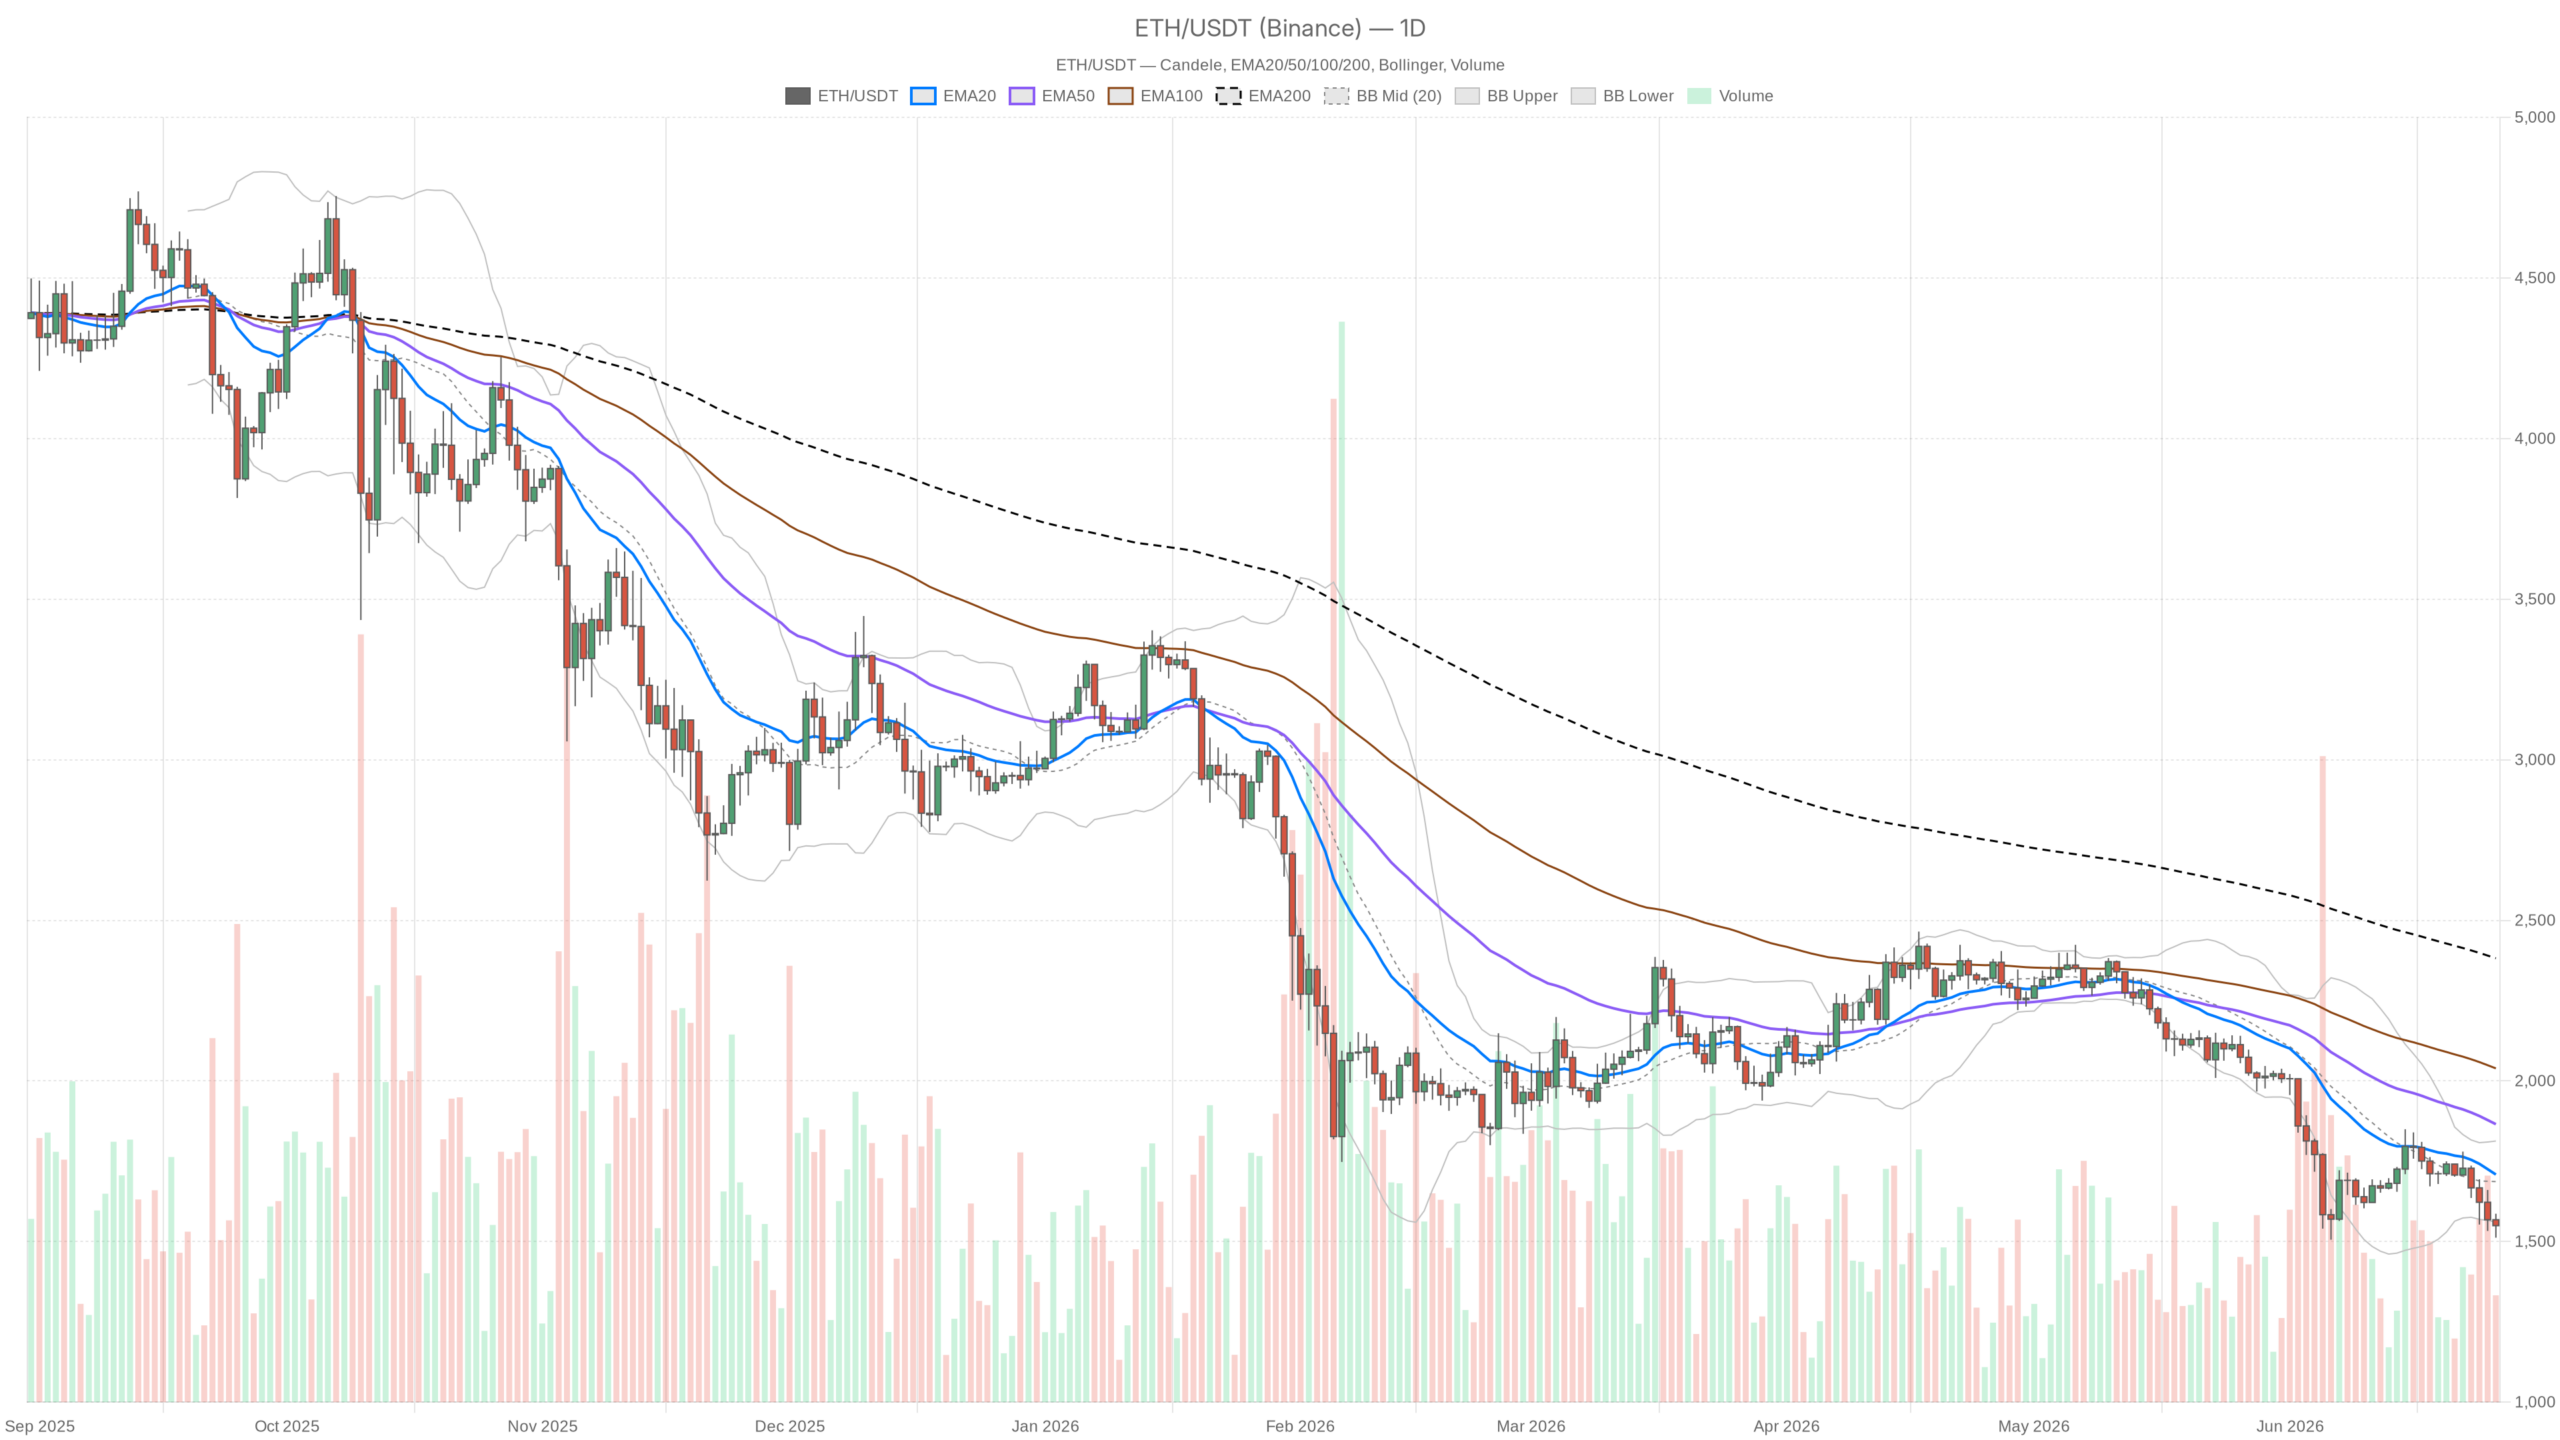 ETH/USDT — daily chart with candlesticks, EMA20/EMA50 and volume.
Key takeaways
- ETH sits below all major daily moving averages, with an $830 gap separating current price from the 200-day EMA at $2,381.
- The daily RSI at 29.47 signals oversold conditions, but no bullish divergence has emerged to confirm a potential reversal.
- A decisive daily close below the $1,512 S1 pivot would likely open the path toward the $1,450–$1,480 support zone.
- The Fear & Greed Index at 13 (Extreme Fear) marks a sentiment extreme that historically precedes sharp but often short-lived bounces.
- On-chain activity is contracting, with Uniswap V3 daily fees down 35.47% in the last 24 hours, per DefiLlama data.
A Fortune article from June 25th confirms the broader narrative: no macro catalyst exists on the near-term horizon capable of reversing this momentum without a significant shift in risk appetite. Bitcoin dominance remains anchored near 55.9%, and capital rotation into ETH is simply absent. The money sits on the sidelines rather than rotating into alts.
The Daily Chart: A Bearish Regime With No Floor in Sight
The daily chart reveals a deeply bearish structure, with Ethereum trading below every meaningful moving average. The 20-day EMA sits at $1,708, the 50-day at $1,865, and the 200-day EMA — a level long-term bulls treat as a structural anchor — rests at $2,381. That represents an $830 gap between current price and the long-term trend, a broken macro structure requiring weeks if not months to repair.
The daily RSI at 29.47 is nudging the oversold zone, but in sustained downtrends RSI can grind along the 30 level for extended periods before any bounce materializes. Moreover, the MACD line at -79.8 remains firmly negative, and while the histogram is barely negative at -1.41, the signal line at -78.39 tracks nearly in lockstep — no meaningful bullish cross or divergence has appeared yet.
The Bollinger Bands add important context. The daily lower band sits at $1,560.37, meaning current price has effectively punched through the statistical floor. Price closing below the lower band at this RSI reading sometimes precedes a short-term snapback. However, the mid-band at $1,686 and upper band at $1,812 look like distant ceilings rather than realistic targets under current conditions. The daily ATR of $82.28 confirms significant intraday range remains.
Pivot levels confirm how narrow the immediate range has become: PP at $1,549.32 mirrors the close, R1 sits at $1,586, and S1 rests at $1,512. A decisive break below $1,512 would clear the last meaningful pivot support, opening the door to further downside with little structural argument for a hold.
The Hourly Picture: A Flicker of Short-Term Relief
The hourly chart offers a slightly less catastrophic view, though not enough to change the broader narrative. ETH at $1,549.58 still trades below its hourly 20 EMA ($1,566), 50 EMA ($1,596), and 200 EMA ($1,666), keeping the regime officially bearish. However, the hourly MACD histogram has ticked positive at +1.67 — the first sign in a while that short-term selling pressure may be easing marginally. The MACD line at -13.2 has crossed above the signal line at -14.87.
The hourly RSI at 41.98 sits in neutral-to-weak territory — not yet oversold, occupying no-man’s land between momentum decline and recovery. Meanwhile, the Bollinger Bands on the 1H frame, with the lower band at $1,536, mid at $1,561, and upper at $1,586, suggest price has room to probe $1,536 before triggering a band-stretch event. The 1H ATR of $19.11 means hourly swings of nearly $20 are perfectly normal, so tight pivot clustering carries limited predictive value.
The 15-Minute Frame: Execution Matters Here
The 15-minute chart is relevant for traders trying to time entries around the $1,549 zone, not for macro analysis. Notably, the 15M MACD histogram has turned sharply negative at -2.60 after the signal line at -0.13 diverged from the MACD line at -2.73. This suggests the very short-term micro-bounce has already stalled. The 15M RSI at 39.08 confirms mild downward pressure. For anyone attempting a long here, the 15M setup points to continued drift lower before any bounce gains traction.
DeFi Activity: Volume Drop Is a Warning Sign
On-chain metrics confirm that Ethereum’s DeFi ecosystem is contracting alongside price. Uniswap V3 — Ethereum’s anchor DEX — saw daily fees drop 35.47% in the last 24 hours, per DefiLlama data, while Fluid DEX declined 29.42% on the same metric. Falling DEX fees serve as a proxy for reduced user engagement with the Ethereum ecosystem. When traders stop swapping, liquidity providers earn less and protocol revenue shrinks — a quiet signal that near-term confidence is low.
Only Uniswap V4 showed a meaningful daily fee increase at +35%, but on a much smaller total base. Ekubo’s staggering -86.52% weekly fee change is an outlier worth monitoring, though it may reflect protocol-specific mechanics rather than pure market sentiment.
Bullish Scenario: What Would Have to Happen
For a legitimate recovery case to materialize, ETH must first hold the $1,512 S1 pivot on a closing basis — the minimum requirement to avoid a fresh leg lower. A sustained reclaim of $1,560–$1,580, which aligns with the hourly Bollinger mid-band and the 1H 20 EMA, would represent the first structural repair. Beyond that, the daily 20 EMA at $1,708 serves as the real test: any move failing to reclaim that level within a reasonable timeframe is likely just a dead-cat bounce being sold into.
The bullish case is invalidated almost immediately if price closes a daily candle below $1,512, because that removes even the weakest pivot support from the picture. In that scenario, any bounce attempts would face an absence of structural footing to build upon.
Bearish Scenario: The Path of Least Resistance
The bearish case is, frankly, easier to construct right now. A daily close below $1,512 opens a move toward the $1,450–$1,480 range, where little structural support is visible on the chart. The broader crypto market selloff — underscored by the -2.6% 24-hour total market cap decline — could accelerate that timeline. Furthermore, the MACD remaining negative on the daily, combined with RSI staying below 35, would confirm that the downtrend has room to run.
This scenario is invalidated only by a sharp reversal with volume, ideally triggered by a macro catalyst — a shift in risk sentiment, a Fed pivot signal, or a significant ETH-specific development — that closes the daily candle back above $1,586. Without such a catalyst, the path of least resistance remains firmly to the downside.
Where Does This Leave Positioning?
The honest assessment is that Ethereum sits in a fragile place. The daily structure is bearish, the macro environment unsupportive, and sentiment — with the Fear & Greed Index at 13 — is already stretched to the downside. That said, extreme fear often precedes violent short-covering rallies, though those rallies frequently fail because the underlying structure has not changed. The Ethereum price today leaves traders navigating a market where the burden of proof rests squarely with the bulls.
Traders engaging the long side here are buying a statistical overshoot — a bet on mean-reversion rather than a trend reversal. That is a fundamentally different trade from positioning for a bull market resumption. Anyone holding ETH as a longer-term position must be realistic about the gap separating current price from the 200-day EMA. Closing that gap requires time and a meaningful shift in the macro narrative.
Ethereum enters the final days of June in a structurally fragile position, with sellers commanding the daily timeframe and buyers yet to produce any convincing response. The gap between current price and the 200-day EMA remains vast. Until macro conditions shift — or until ETH reclaims key levels above $1,586 — the path of least resistance remains lower.
FAQ
Why is the Ethereum price today trading below all major moving averages?
The daily chart shows ETH at $1,549, sitting well below the 20-day EMA ($1,708), 50-day EMA ($1,865), and 200-day EMA ($2,381). This reflects sustained selling pressure, an absence of macro catalysts, and capital remaining parked in Bitcoin rather than rotating into altcoins.
What level must Ethereum hold to avoid further downside?
The $1,512 S1 pivot represents the last meaningful support on the daily chart. A decisive daily close below this level would clear the final structural floor and likely accelerate a move toward the $1,450–$1,480 range.
Is the Fear & Greed Index at 13 a buy signal for Ethereum?
Extreme Fear readings historically precede sharp short-covering rallies, but these bounces often fail to sustain because the underlying structure remains bearish. Traders should treat any bounce as a mean-reversion opportunity rather than a trend reversal until the daily 20 EMA at $1,708 is reclaimed.
&
Disclaimer: This article is for informational purposes only and does not constitute financial advice, an investment recommendation, or a solicitation to buy or sell any financial instrument or cryptocurrency. The analysis provided is not indicative of future results. Investing in crypto assets and financial markets carries a high risk of capital loss. Always do your own research (DYOR) and consult a qualified financial advisor before making any decision.
Article produced with the assistance of artificial intelligence and reviewed by the editorial team.
You May Also Like

Ethereum koers toont zeldzaam dubbel koopsignaal en richt zich op $4.550

Fed Day Dry Powder: Cryptoquant Analyst Tracks $7.6B Stablecoin Pile on Exchanges
Michael Saylor’s Bitcoin Treasury Strategy Has Finally Hit Its Breaking Point

