-
XRP sentiment has fallen to one of its lowest levels of 2026, which usually precedes relief rallies when technical conditions begin to improve.
-
Technically, XRP is testing its 200-week SMA; reclaiming $1.50-$1.55 remains crucial to confirm a bullish reversal
After consolidating within a predefined range, the XRP price is experiencing a major sell-off and has remained stuck around $1.14. Although the bulls are attempting a quick rebound, the lack of conviction has capped the rally below $1.20. This comes at a time when the XRP sentiment has dropped to one of its lowest levels of 2026. This highlights just how bearish investors have become after weeks of price weakness. When fear reaches such extremes, markets often reach a turning point.
The bigger question is whether XRP is approaching a long-term buying opportunity or if the current weakness is simply the beginning of a deeper correction.
XRP Sentiment Falls to Extreme Levels
The latest Santiment data shows XRP’s weighted sentiment falling to its weakest reading of the year, reflecting declining optimism across the community. As prices continue to slide, traders appear to be losing confidence, pushing sentiment into historically pessimistic territory.
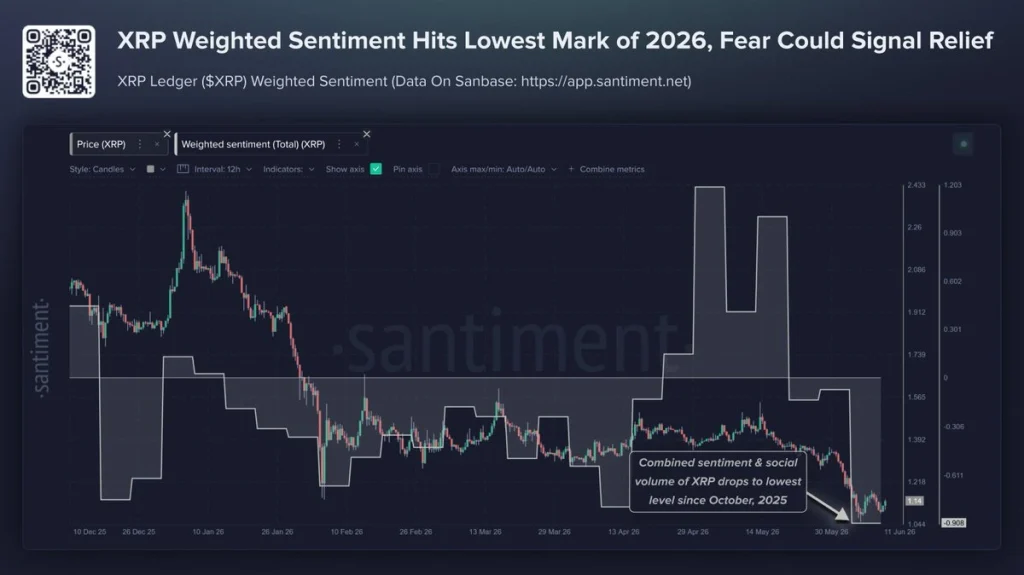
Ironically, these periods of extreme fear have often attracted contrarian investors. When most market participants expect further downside, even a modest improvement in sentiment or price action can trigger a sharp recovery.
XRP Price Analysis: The Weekly Chart Is Testing a Critical Support Zone
XRP is now trading at one of the most important technical levels on its weekly chart. The price has fallen toward the 200-week Simple Moving Average, a level that has historically acted as a strong support during broader bullish cycles. The Bollinger Bands also suggest that selling pressure has intensified.
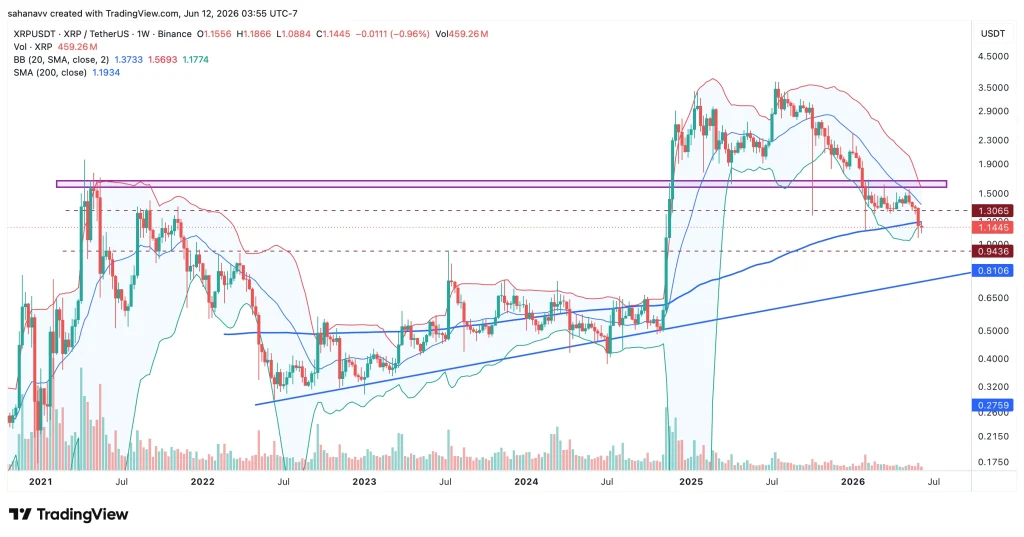
XRP is trading close to the lower Bollinger Band, indicating that the market has moved toward the lower end of its recent range. While this does not guarantee a reversal, assets often stabilize or witness relief rallies after becoming stretched to the downside. The RSI has slipped to around 30, placing XRP near oversold territory and showing that bearish momentum has become increasingly dominant. Meanwhile, the MACD remains below the signal line, confirming that the broader trend is still weak.
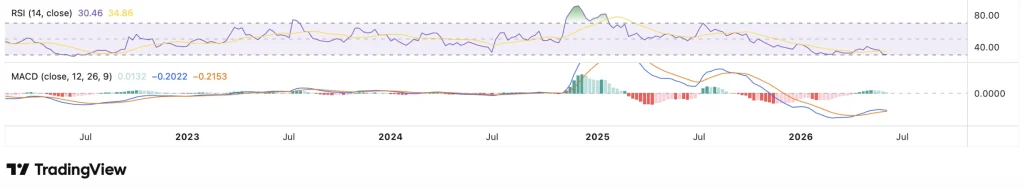
However, the histogram has started to flatten, suggesting that downside momentum may be slowing even though buyers have yet to regain control. For the bullish case to strengthen, XRP needs to reclaim the $1.50-$1.55 resistance zone. Until then, the chart points to a market that is testing major support but has not yet confirmed a trend reversal.
As long as XRP holds above this area, the long-term structure remains intact. A decisive break below it, however, could shift momentum toward the next major support near $0.94.
The Bottom Line
XRP is entering a decisive phase where sentiment and technicals are sending mixed but interesting signals. Investor confidence has fallen to one of its weakest levels of the year, while the price is testing a long-term support zone and approaching oversold conditions.
History shows that periods of extreme pessimism can often precede meaningful recoveries, but confirmation is still missing. If buyers defend the current support and momentum indicators begin to turn, XRP could be setting up for a relief rally. If not, a break below key support would increase the risk of a deeper correction before the next sustainable uptrend begins.