

Cardano’s (ADA) Price: What the TD Sequential Buy Signal and Whale Accumulation Mean Right Now
TLDR
- ADA is trading around $0.25 after five straight days of losses, with a slight 0.68% recovery on Wednesday.
- Whale wallets accumulated roughly 250 million ADA tokens since May 11, signaling long-term interest.
- The long-to-short ratio sits at 0.80, below 1.0, reflecting more bearish bets than bullish ones in derivatives markets.
- ADA remains below its 50-, 100-, and 200-day EMAs, with RSI at 43 and MACD in negative territory.
- Analyst Ali Charts flagged a TD Sequential buy signal, with a first rebound target of $0.255 and a key support level at $0.246.
Cardano (ADA) is attempting a small recovery after posting five consecutive red candles. The token is trading at around $0.2499, up roughly 0.68% in the past 24 hours. Despite the modest bounce, the broader technical picture remains under pressure.
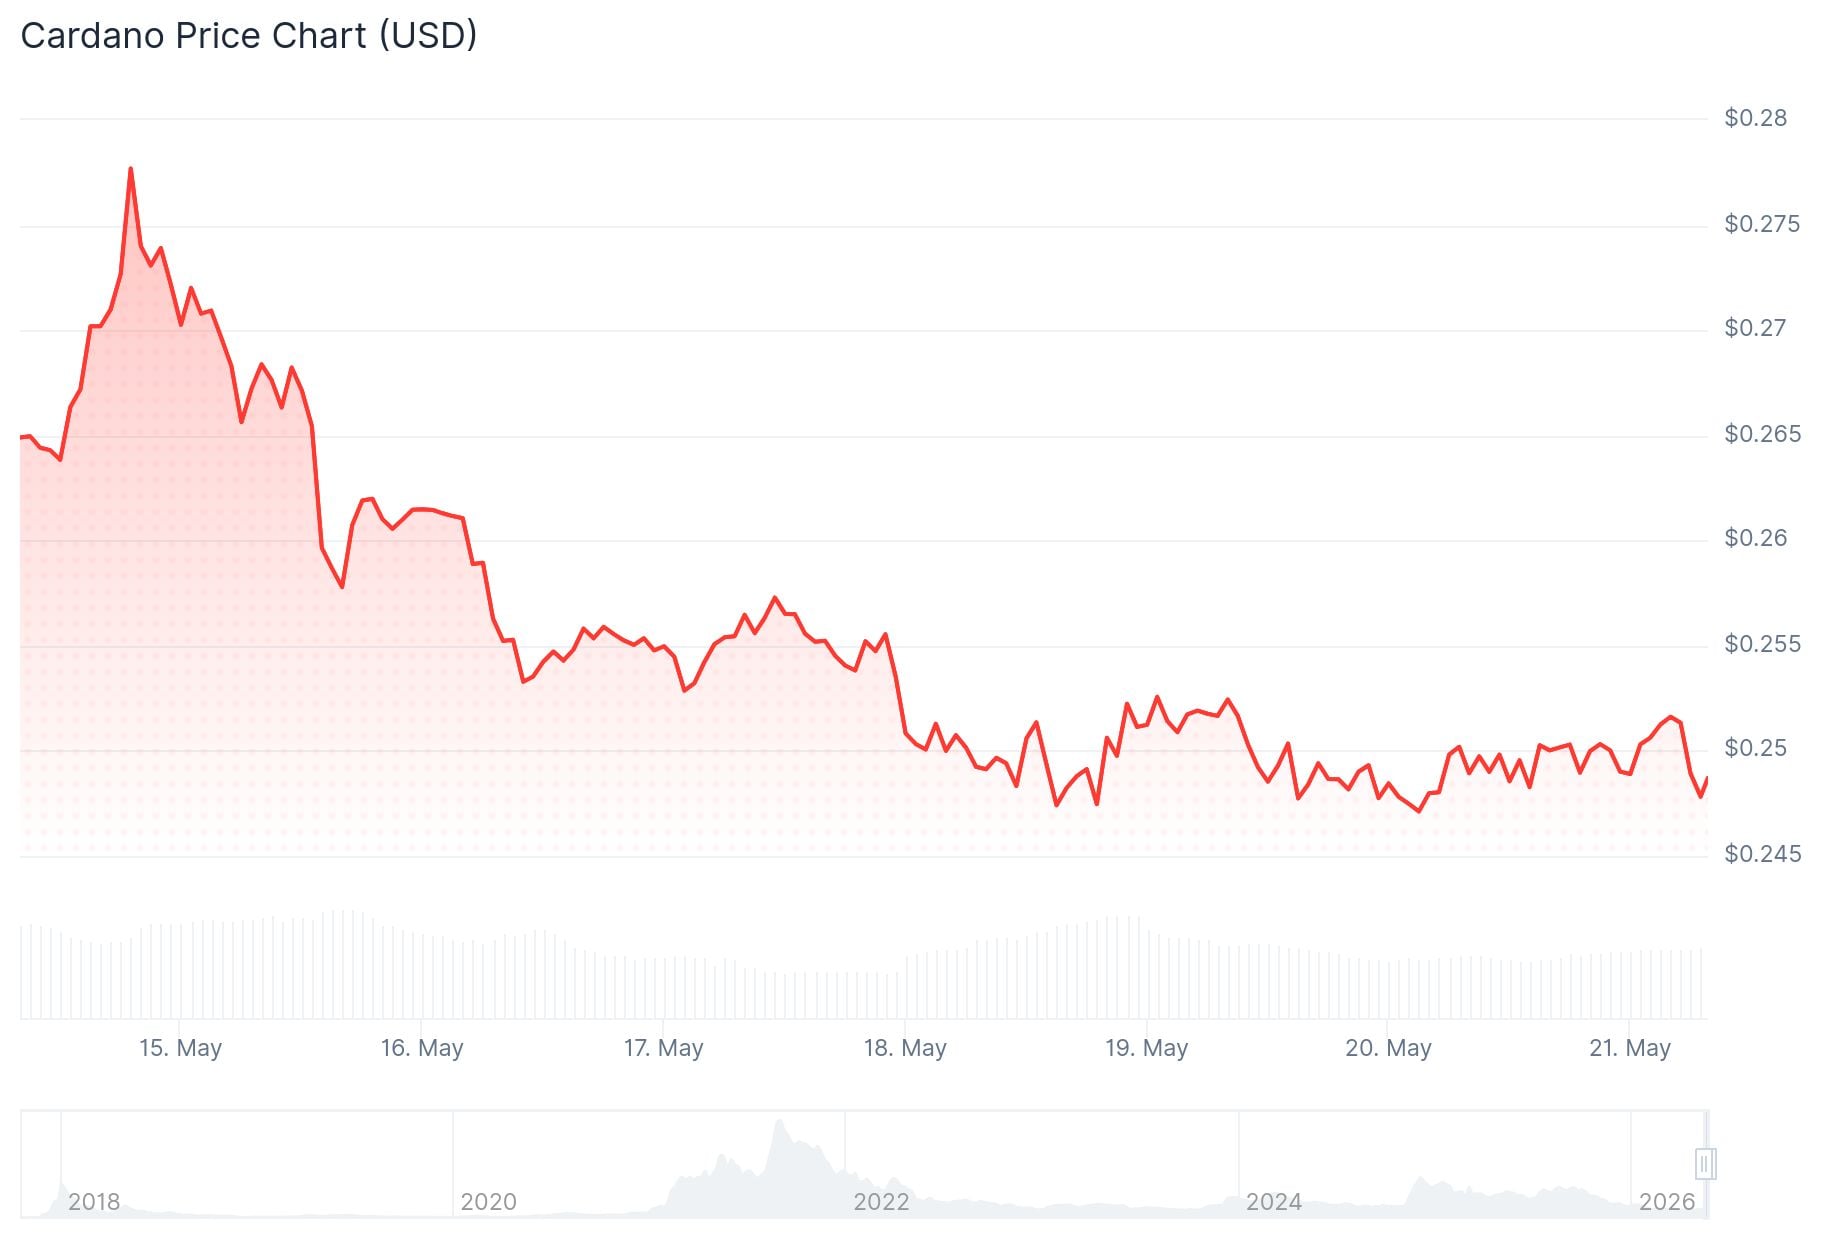 Cardano (ADA) Price
On-chain data from Santiment shows that large wallet holders, commonly known as whales, have been buying the dip. Wallets holding between 100,000 and 100 million ADA have collectively added around 250 million tokens since May 11. That kind of accumulation at lower price levels often reflects confidence in the longer-term value of an asset.
Analyst Ali Charts posted on X (formerly Twitter) that the TD Sequential indicator, which correctly called the 15% drop from May 10, has now flashed a buy signal. He stated that a local bottom may be forming, with an initial rebound target of $0.255 and a secondary target of $0.262. He also noted that the $0.246 support zone must hold on a daily close for the bullish setup to remain valid.
Technical Picture Still Bearish
ADA is trading below its 50-day, 100-day, and 200-day exponential moving averages, sitting at $0.258, $0.280, and $0.355 respectively. The RSI is hovering at 43, and the MACD remains in negative territory. Both readings point to weak momentum and suggest that any rallies could run into resistance quickly.
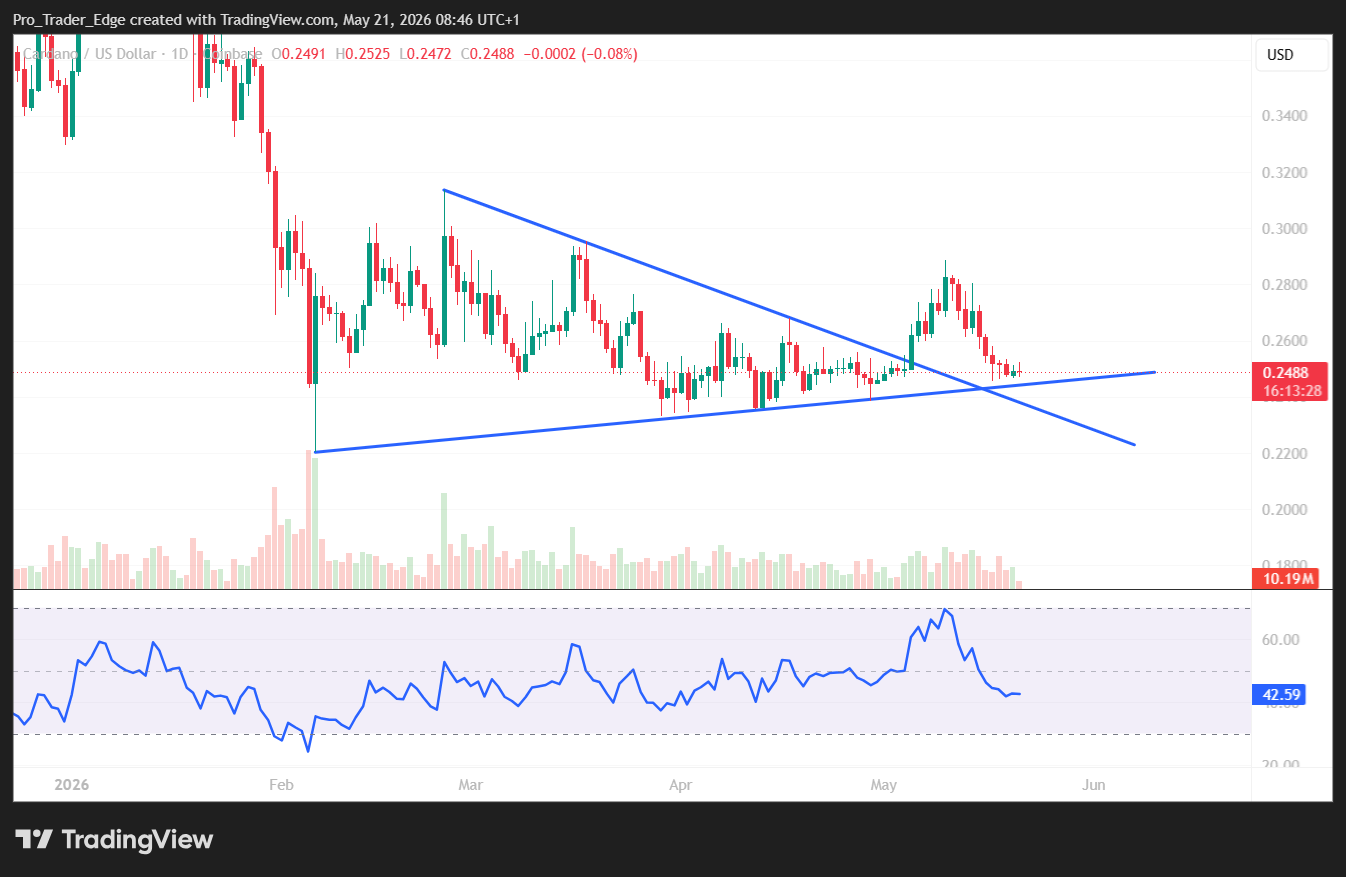 Source; TradingView
The Bollinger Bands show ADA consolidating near the midline, and the token is holding above the lower band near $0.2393. This keeps the structure from breaking down entirely, but it is not a bullish setup either.
Key resistance levels to watch are the 50-day EMA at $0.258, followed by the 23.6% Fibonacci retracement at $0.271 and a trendline break level at $0.274. On the downside, support sits at $0.245, then $0.236, with a deeper floor near the February low of $0.220.
RWA Initiative Adds a Fundamental Layer
The Cardano Foundation recently published a new Real-World Asset (RWA) tokenization case study through Cardano Academy. The post highlighted how real-world assets can be tokenized using Cardano’s existing infrastructure. The move is part of a broader push by the Cardano ecosystem into practical blockchain use cases.
In the derivatives market, the picture is mixed. The long-to-short ratio from CoinGlass reads 0.80, its lowest in over a month. At the same time, the OI-weighted funding rate turned positive on Sunday and reads 0.0072%, suggesting that long positions are paying shorts, a mild signal of improving sentiment.
The $0.246 support zone identified by Ali Charts remains the level to watch heading into the next daily close.
The post Cardano’s (ADA) Price: What the TD Sequential Buy Signal and Whale Accumulation Mean Right Now appeared first on CoinCentral.


You May Also Like

Breaking Down Settlement Factors in Formula Injury Lawsuits

India Busts ₹226 Crore Crypto Network Linked to Drugs and Terror Financing

Ripple (XRP) News Today: May 21


