

RENDER Price Prediction: How High Can It Go in 2026 After 80% Decline?
Render (RENDER) has spent the better part of 2 years in a slow, grinding decline that has quietly erased more than 80% of its value since March 2024. The token has formed a textbook pattern of lower highs and lower lows across that entire period. RIght now, the price appears to be stabilizing, and the network itself has been quietly stacking real upgrades.
So the question worth asking now is straightforward: How high can RENDER’s price actually go before the end of 2026?
RENDER price touched a 2026 low of around $1.1 before finding some footing, and it currently trades close to $1.9. That recovery is not dramatic, and the overall trend is still consolidating without any major catalyst pushing price decisively in either direction.
There is no obvious bull trigger on the horizon right now, and equally, no specific bearish narrative targeting Render as a project. The price has simply been moving sideways to slightly upward from a multi-year low, which is often where stabilization begins before any meaningful directional move.
The Fundamental Drivers That Could Push RENDER Higher This Year
One of the clearest tailwinds for the Render network is the alleged global shortage of high-end GPU chips like NVIDIA’s H100 and B200. Centralized providers such as AWS cannot always meet demand at competitive prices, and decentralized GPU networks like Render become attractive alternatives when that happens.
The Burn-and-Mint Equilibrium model that governs RENDER token economics adds another dimension here. As more AI and 3D rendering tasks run through the network, more tokens get burned. Higher burn rates reduce circulating supply, which can create deflationary pressure that supports higher valuations over time.
Real-world adoption has also been building quietly. The Render network powered A$AP Rocky’s “Helicopter” music video and 18K immersive exhibits, which demonstrates that the network is not theoretical. Enterprise and creative studios are using it, and that kind of visible deployment tends to build institutional credibility.
RENDER price also tends to move in correlation with the broader AI sector and the Nasdaq-100. That means general tech sentiment remains a key variable. A recovering risk appetite in tech equities would likely lift RENDER alongside it.
Recent Network Upgrades Have Meaningfully Expanded What Render Can Handle
Recent governance decisions have expanded the network’s capabilities considerably. RNP-023, which passed fully in April 2026, integrated the Salad Network and added roughly 60,000 GPUs to the total compute available on Render. That is a significant expansion of capacity for AI workloads that were previously constrained.
RNP-021 opened the door to enterprise-grade hardware including NVIDIA H200 and AMD MI300X chips. This means the network can now handle large-scale AI training workloads that were previously out of reach. Studios and developers working on demanding projects now have access to considerably more compute power through the network.
The Octane 2026 rendering engine also launched fully within the network this year, removing friction for professional creative pipelines. The migration to Solana underpins all of this by enabling faster and cheaper transactions. That matters significantly for real-time spatial computing and high-frequency AI inference jobs where speed is non-negotiable.
What the RENDER Price Chart Reveals About Where It Could Be Headed
A look at the RENDER chart going back to early 2024 reveals a descending channel pattern that has held remarkably consistently. The important observation from that pattern is that the current price of around $1.9 sits much closer to the bottom of the channel than the top. Historically, assets trading near the floor of an established channel tend to produce meaningful rallies when broader momentum returns.
A move of around 200% from the current level fits comfortably within that channel structure. That would take RENDER price from $1.9 to somewhere above $6 before the end of 2026. The channel itself has been consistent enough to treat that as a reasonable projection rather than a stretch target.
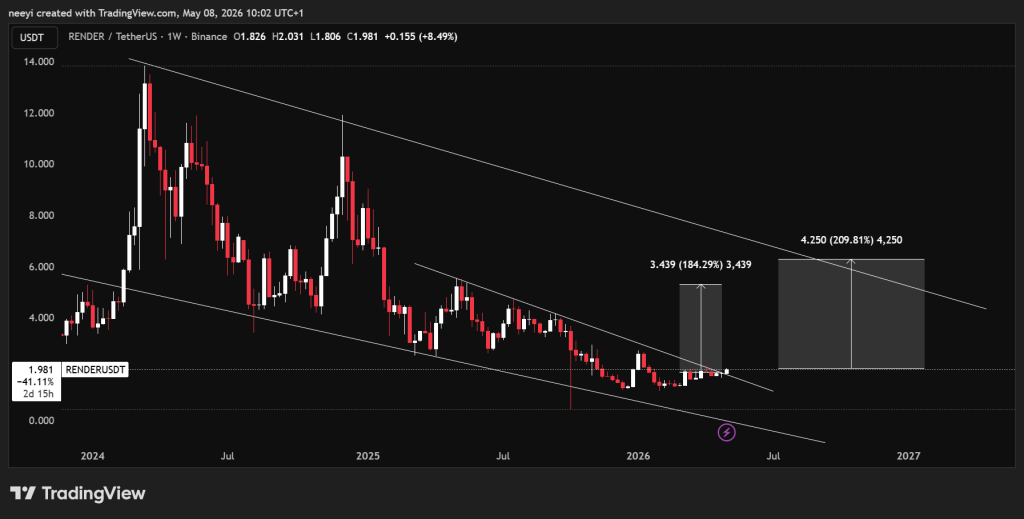 RENDER Price Chart / Source: TradingView.com
Zooming into the chart also reveals a shorter-term trend that began in May 2025. That trend has recently broken out to the upside, which points to a possible medium-term recovery. The initial target from that breakout sits around $5.2, which corresponds to the upper boundary of the descending trendline.
A clean breakout above $5.2 would then open the path toward the $6 area, aligning with the broader channel target. These 2 levels, $5.2 and $6, form a logical sequence of resistance points that RENDER price would need to clear. The chart structure supports both as realistic destinations if buying pressure continues.
The Broader Crypto Cycle Suggests 2026 May Be a Year of Measured Moves
One factor worth keeping in perspective is where 2026 sits within the traditional 4-year crypto cycle. Bitcoin reached an all-time high of approximately $126,000 in October 2025, roughly 18 months after the April 2024 halving. The cycle model historically places the post-peak consolidation phase in the months that follow, which is where 2026 currently sits.
That structural positioning means a broad altcoin bull run may not materialize this year. A more muted macro backdrop would make the $5.2 to $6 range the realistic ceiling for RENDER price in 2026. The channel analysis and the cycle context both point toward the same conclusion.
An optimistic scenario where fresh capital rotates aggressively into AI tokens could target the previous swing high around $12. That would represent close to 500% from the current level. However, that scenario requires conditions that go meaningfully beyond what the current cycle positioning suggests for this year.
Read Also: Terra Classic (LUNC) Price Jumped 200%, but Is $1 Realistic?
How High RENDER Price Could Go in 2026: Three Scenarios
Based on the chart structure, the network fundamentals, and the current macro environment, 3 distinct price targets emerge for RENDER in 2026.
| Scenario | Target Price | Upside | What Would Drive It |
|---|---|---|---|
| Base Breakout Target | $5.20 | ~174% from ~$1.90 | Channel breakout reaches the upper descending trendline. Broad crypto market stabilizes. No major macro shock. This is the weakest scenario and the first meaningful resistance level. |
| Channel Top | ~$6.00 | ~216% from ~$1.90 | RENDER breaks above $5.20 and extends to the full descending channel target. AI sector sentiment remains positive. GPU demand and BME burns accelerate. This is the most likely ceiling in a moderate 2026 environment. |
| Optimistic Swing High | ~$12.00 | ~531% from ~$1.90 | A broader altcoin rally brings fresh capital into AI tokens. Render fundamentals attract institutional attention. Previous swing high becomes the target. This scenario requires significant macro tailwinds beyond what the 4-year cycle model suggests for 2026. |
The $5.2 level is the first realistic milestone because the chart structure directly supports it. A move above that opens the door to just above $6, which is where the broader descending channel analysis points under normal conditions. Both of these targets sit within reach if the crypto market avoids a deeper sell-off and Render’s network activity continues growing.
The $12 level is a different conversation entirely. It represents the previous swing high and would require a macro environment that goes well beyond what 2026 is currently set up to deliver. Render has built something real, and the upgrades this year back that up. Whether the RENDER price fully reflects that reality in 2026 depends largely on what the broader market decides to do next.
FAQs
Subscribe to our YouTube channel for daily crypto updates, market insights, and expert analysis.
The post RENDER Price Prediction: How High Can It Go in 2026 After 80% Decline? appeared first on CaptainAltcoin.


You May Also Like

Strategy Pauses Bitcoin Buying Ahead of Q1 Earnings, Saylor Confirms

GMX perpetual markets expand to MegaETH with Chainlink for real-time DeFi trading


