Ethereum (ETH) Price Analysis: May 2026 Could Bring Extreme Volatility — What Traders Need to Know
Key Takeaways
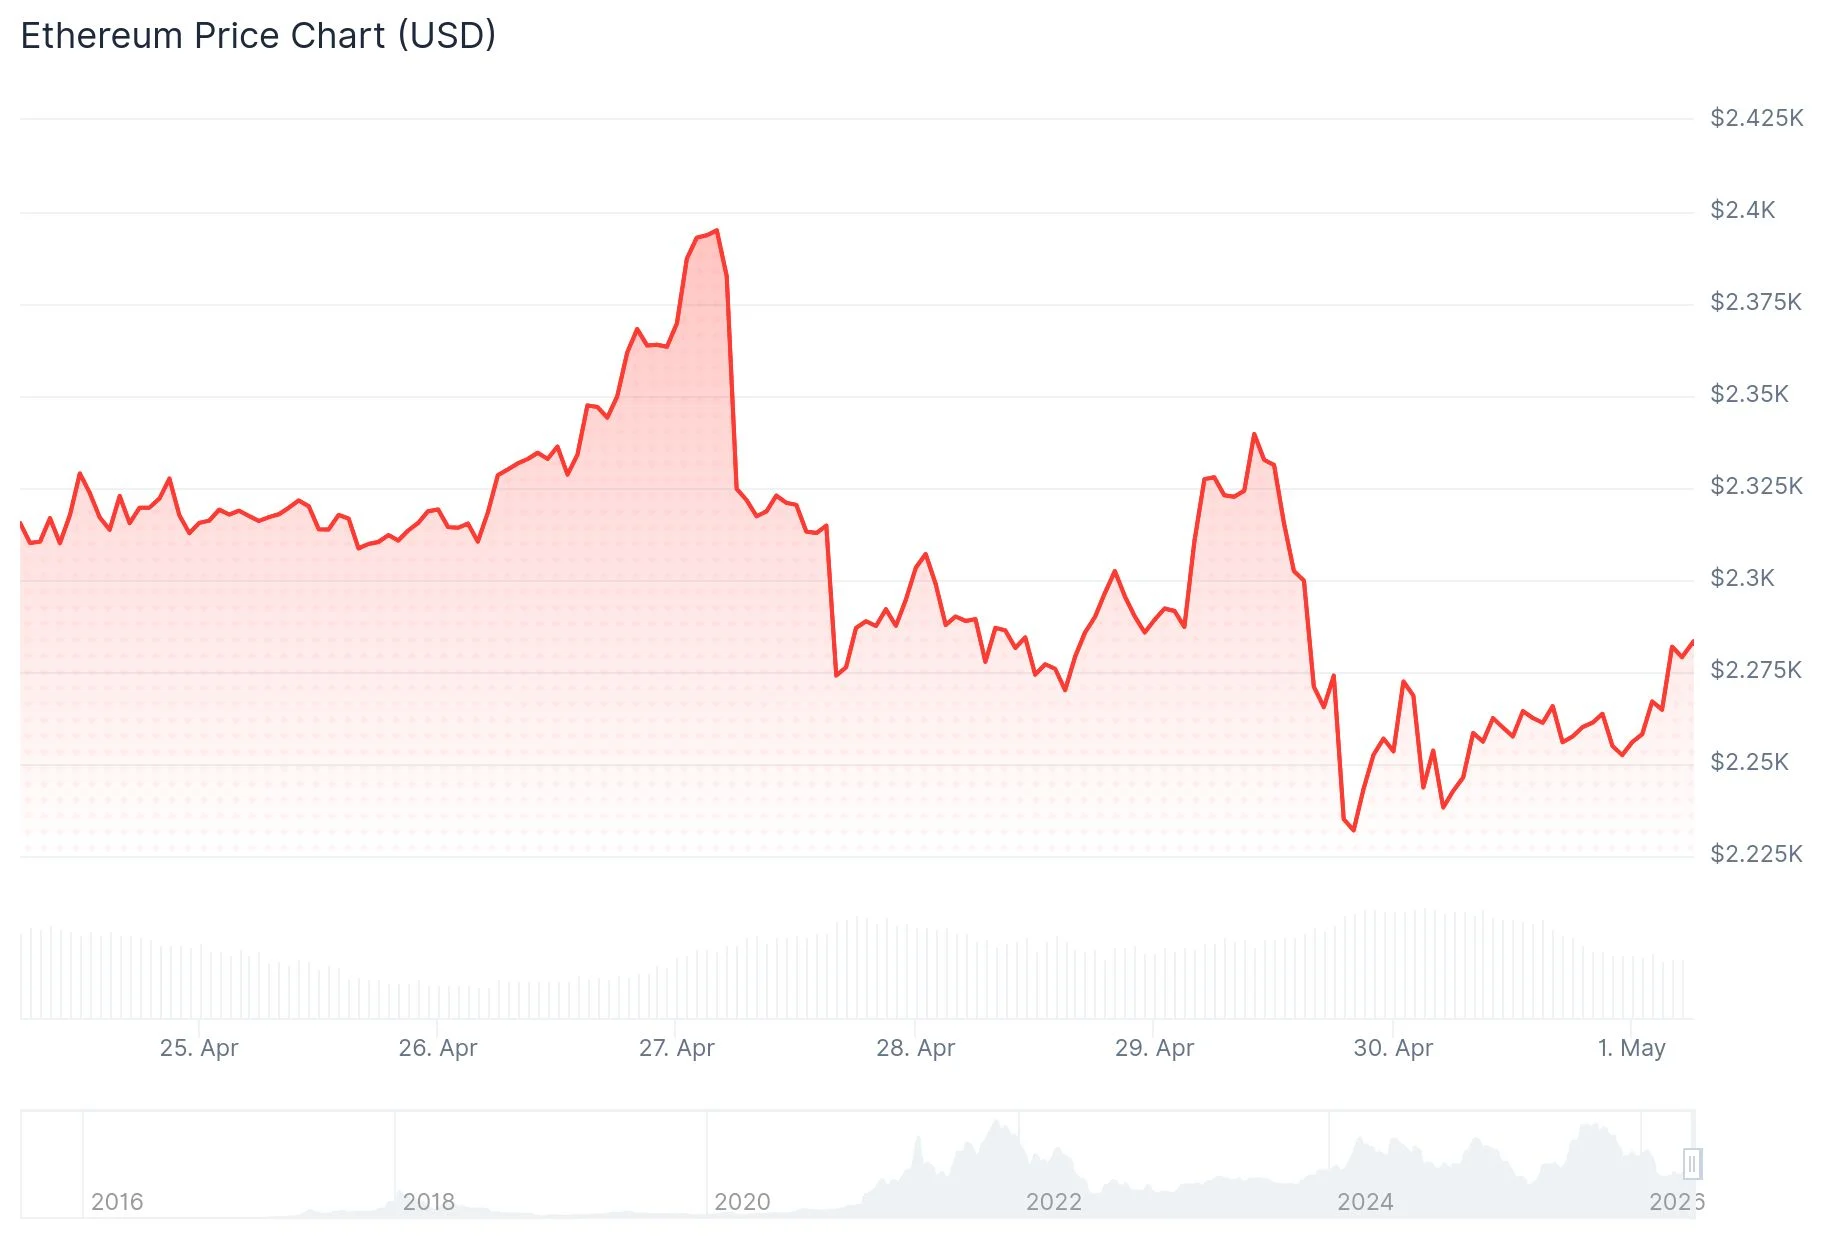
- Ethereum currently trades near $2,260, pressured by elevated US inflation figures and broader macroeconomic uncertainty.
- Derivatives metrics reveal negative taker buy-sell ratios alongside negative funding rates, signaling bearish near-term sentiment.
- Crypto analyst Ted Pillows highlights that breaking below the $2,150–$2,200 range could accelerate downward momentum.
- Binance-specific data indicates bullish positioning, with its taker buy-sell ratio exceeding 1.
- Historical trends show May ranks among Ethereum’s most unpredictable months, characterized by dramatic price fluctuations.
Ethereum finds itself trading around the $2,260 mark as macroeconomic pressures and conflicting derivatives signals define the near-term trajectory entering the volatile month of May.
 Ethereum (ETH) Price
The United States Personal Consumption Expenditures (PCE) Price Index registered a 3.5% year-over-year increase in March, climbing from the previous 2.8%. Core PCE, the Federal Reserve’s favored inflation gauge, reached 3.2% — marking its peak since November 2023. Elevated inflation readings diminish the likelihood of near-term rate reductions, typically dampening appetite for risk assets including cryptocurrencies.
Meanwhile, escalating geopolitical tensions across the Middle East contribute to the broader risk-off sentiment pervading global markets.
Within Ethereum’s perpetual futures ecosystem, the taker buy-sell ratio has slipped below neutral. This indicator measures the balance between aggressive buyers and sellers executing market orders on perpetual contracts. Its 14-day moving average has trended downward throughout the latter half of April.
 Source: CryptoQuant
Concurrently, ETH funding rates have remained in negative territory throughout this timeframe. When funding rates turn negative, it indicates short sellers are compensating longs, reflecting pessimistic short-term market expectations.
Total open interest has stabilized around 13.5 million ETH, declining from the 14.4 million ETH recorded on April 18. This contraction suggests market participants are reducing exposure rather than establishing fresh positions.
Critical Price Zones Under Focus
Technically, ETH continues trading beneath its 20-day exponential moving average at $2,287 and its 100-day EMA positioned near $2,365. The Relative Strength Index (RSI) remains anchored around the neutral 50 threshold, while the Stochastic Oscillator has descended into oversold conditions.
Ethereum’s realized price — representing the aggregate on-chain acquisition cost — stands at $2,308, functioning as resistance. Multiple attempts to breach this threshold have failed, indicating holders are distributing when reaching breakeven levels.
Immediate support emerges at $2,211, complemented by the 50-day EMA near $2,244. Should these levels fail, subsequent downside targets include $2,108, $1,909, and $1,741.
Market analyst Ted Pillows identified the $2,150–$2,200 corridor as pivotal, warning that “the dump will accelerate” if ETH breaches this zone. He perceives this area as a potential launching pad for renewed upward momentum.
Over the past 24 hours, ETH witnessed $38.2 million in total liquidations, with $19.5 million stemming from short position closures.
Binance Derivatives Signal Bullish Divergence
Specifically on Binance, the taker buy-sell ratio has climbed above 1, according to CryptoQuant analytics referenced by market observer Rei Researcher. This diverges from the broader market narrative, indicating that Binance traders are exhibiting more aggressive buying behavior compared to sellers.
Open interest has experienced modest growth from recent troughs, suggesting gradual accumulation of long positions. Nevertheless, overall leverage expansion remains constrained, minimizing the probability of cascading liquidation events.
Historical May Volatility Context
Archival data compiled by CoinGlass reveals that May consistently ranks among Ethereum’s most turbulent months. Both average and median returns during May occupy extreme positions relative to other calendar months — featuring pronounced peaks and troughs.
Trader Daan Crypto Trades emphasized this seasonal pattern, observing that May typically delivers exaggerated directional movements rather than controlled, linear progression.
As May 2026 commenced, ETH was positioned near $2,261.
The post Ethereum (ETH) Price Analysis: May 2026 Could Bring Extreme Volatility — What Traders Need to Know appeared first on Blockonomi.


You May Also Like

BitGo Launches Revolutionary Institutional Stablecoin Service for Major Financial Players

Stablecoins surpass Bitcoin in purchases across Latin America