XRP faces a critical 60% valuation reset. As exchange liquidity hits record lows, will Ripple's native token bounce back to $1.50 or sink further?XRP faces a critical 60% valuation reset. As exchange liquidity hits record lows, will Ripple's native token bounce back to $1.50 or sink further?

XRP Price Prediction: Can Ripple Reclaim $1.50 Amid Record Low Liquidity?

2026/03/07 20:59
2 min read
For feedback or concerns regarding this content, please contact us at crypto.news@mexc.com

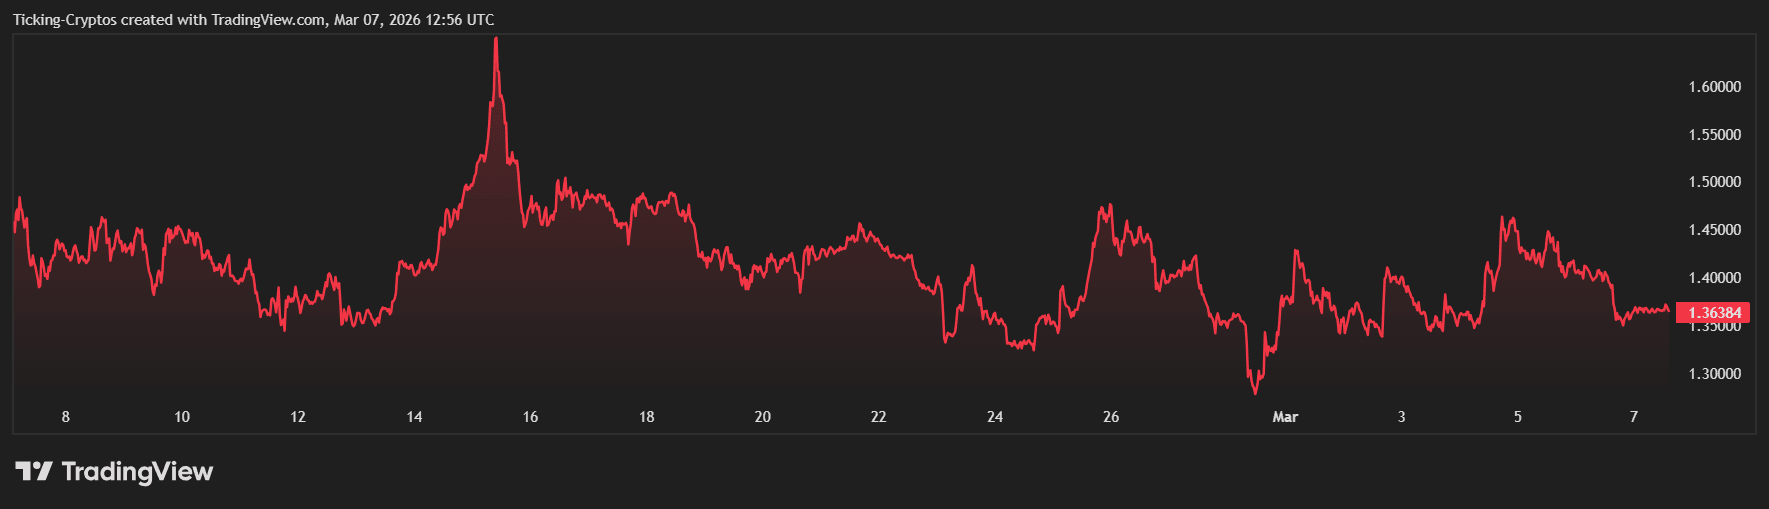
As of March 7, 2026, $XRP is currently trading around $1.42, showing signs of a "post-crash purge." After a massive 60% decline from its 2025 highs, the asset is attempting to stabilize. However, the technical structure remains fragile as it faces a significant rejection at the $1.45 resistance zone.

Why is XRP Price Down? 

Recent on-chain data highlights a record low in exchange liquidity for XRP. While a decline in exchange reserves is often viewed as bullish (suggesting less immediate sell pressure), it also increases volatility. If a major buy-side order hits the market, the thin liquidity could trigger a rapid move toward $1.50. Conversely, a failure to hold current levels could see a "stop-run" toward the $1.11 support.

XRPUSD_2026-03-07_14-56-31.pngXRP Price in USD

Geopolitical Macro: The "Operation Epic Fury" Impact

The ongoing "Second Iran War" has introduced a unique dynamic for XRP. Following the US-Israeli strikes on February 28, 2026, and the subsequent targeting of Iranian leadership, XRP has functioned as a "proxy" for regional liquidity. While the XRP-USD price dropped 3.2% in the last 24 hours, on-chain data suggests a spike in "sanctions-busting" flows. 

With the Strait of Hormuz facing potential blockades, the demand for cross-border, non-fiat settlement via the XRP Ledger (XRPL) is rising, even as the "risk-off" sentiment from the war keeps a ceiling on the price.

XRP Price Prediction: The Path to $2

For the bullish thesis to remain intact, XRP must secure a daily close above the $1.45 horizontal barrier. Analysts point to a historical chart pattern similar to the 2017 breakout. 

If this fractal plays out, a mid-term target of $4.00 is possible by late March. However, the immediate RSI remains neutral-bearish at 44, suggesting the "wait-and-see" approach from institutional investors continues.

  • Key levels to watch:
  • Resistance: $1.45, $1.50
  • Support: $1.35, $1.27
Disclaimer: The articles reposted on this site are sourced from public platforms and are provided for informational purposes only. They do not necessarily reflect the views of MEXC. All rights remain with the original authors. If you believe any content infringes on third-party rights, please contact crypto.news@mexc.com for removal. MEXC makes no guarantees regarding the accuracy, completeness, or timeliness of the content and is not responsible for any actions taken based on the information provided. The content does not constitute financial, legal, or other professional advice, nor should it be considered a recommendation or endorsement by MEXC.

You May Also Like

Pi Network Surges 35.9% Weekly: On-Chain Data Reveals Unexpected Accumulation Pattern

Pi Network Surges 35.9% Weekly: On-Chain Data Reveals Unexpected Accumulation Pattern

Pi Network's 12.1% daily surge masks a more significant story: the token has rallied 35.9% over seven days while maintaining 76.5% below its all-time high. Our
Share
Blockchainmagazine2026/03/08 07:01
IRS Sets Course for Digital-Only Tax Reporting for Cryptocurrency Users

IRS Sets Course for Digital-Only Tax Reporting for Cryptocurrency Users

The post IRS Sets Course for Digital-Only Tax Reporting for Cryptocurrency Users appeared on BitcoinEthereumNews.com. A bold move by the United States Internal
Share
BitcoinEthereumNews2026/03/08 07:38
3 Paradoxes of Altcoin Season in September

3 Paradoxes of Altcoin Season in September

The post 3 Paradoxes of Altcoin Season in September appeared on BitcoinEthereumNews.com. Analyses and data indicate that the crypto market is experiencing its most active altcoin season since early 2025, with many altcoins outperforming Bitcoin. However, behind this excitement lies a paradox. Most retail investors remain uneasy as their portfolios show little to no profit. This article outlines the main reasons behind this situation. Altcoin Market Cap Rises but Dominance Shrinks Sponsored TradingView data shows that the TOTAL3 market cap (excluding BTC and ETH) reached a new high of over $1.1 trillion in September. Yet the share of OTHERS (excluding the top 10) has declined since 2022, now standing at just 8%. OTHERS Dominance And TOTAL3 Capitalization. Source: TradingView. In past cycles, such as 2017 and 2021, TOTAL3 and OTHERS.D rose together. That trend reflected capital flowing not only into large-cap altcoins but also into mid-cap and low-cap ones. The current divergence shows that capital is concentrated in stablecoins and a handful of top-10 altcoins such as SOL, XRP, BNB, DOG, HYPE, and LINK. Smaller altcoins receive far less liquidity, making it hard for their prices to return to levels where investors previously bought. This creates a situation where only a few win while most face losses. Retail investors also tend to diversify across many coins instead of adding size to top altcoins. That explains why many portfolios remain stagnant despite a broader market rally. Sponsored “Position sizing is everything. Many people hold 25–30 tokens at once. A 100x on a token that makes up only 1% of your portfolio won’t meaningfully change your life. It’s better to make a few high-conviction bets than to overdiversify,” analyst The DeFi Investor said. Altcoin Index Surges but Investor Sentiment Remains Cautious The Altcoin Season Index from Blockchain Center now stands at 80 points. This indicates that over 80% of the top 50 altcoins outperformed…
Share
BitcoinEthereumNews2025/09/18 01:43