

Energy Crisis 2026: Brent Oil and LNG Rates Explode Amid Iran Conflict
The global energy landscape has shifted overnight. Following the escalation of military operations by the United States and Israel against Iran in early March 2026, the Strait of Hormuz—the world’s most critical maritime chokepoint—has seen a near-total halt in traffic. This disruption has sent shockwaves through both the fossil fuel and maritime logistics sectors, forcing traders and analysts to re-evaluate supply security in real-time.
Brent Crude Price Analysis
The price of Brent Crude Oil has experienced a vertical move on the charts. After trading in a relatively stable range earlier in the year, the onset of hostilities saw prices jump by approximately 18% within just six days.
As of March 6, 2026, Brent is testing the $84 per barrel mark, with some analysts at Goldman Sachs suggesting a "risk premium" of up to $15 could be added if the closure of the Strait remains absolute. Technical indicators show a clear "breakout" pattern, driven by the fear that 20% of the world's daily oil supply is currently stranded behind a naval blockade.
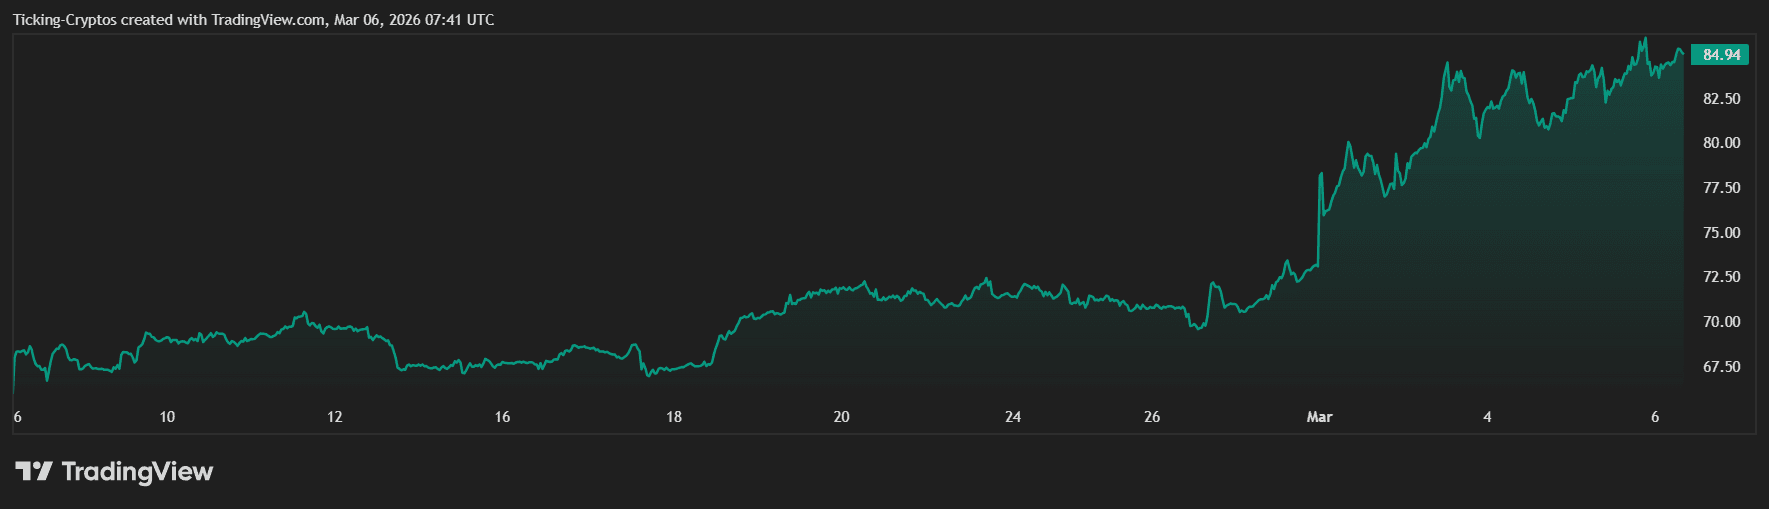 BRENT CRUDE OIL in USD
What are LNG Shipping Rates?
Before diving into the surge, it is essential to understand the metric. LNG shipping rates (or charter rates) represent the daily cost to hire a specialized tanker to transport Liquefied Natural Gas across the ocean. These rates are highly sensitive to "tonne-mile" demand—the distance a cargo must travel and the time a vessel is occupied.
LNG Rates Surge: From $40,000 to $300,000
The most dramatic escalation, however, is not in the commodity itself but in its transportation. LNG spot charter rates have surged from a baseline of $40,000 per day to as high as $300,000 per day—a staggering 650% increase.
Why the Massive Spike?
- Vessel Entrapment: Many tankers are currently "trapped" or stationary near the Persian Gulf, unable to exit the Strait of Hormuz safely.
- Rerouting: Ships previously destined for the Gulf are being diverted to the US or Australia, significantly increasing voyage lengths and absorbing all available global "spot" capacity.
- Force Majeure: Major producers like QatarEnergy have suspended production and declared force majeure, leaving buyers in Asia and Europe scrambling to secure any available vessel to bring gas from alternative, more distant sources.
Bitcoin Price Analysis: BTC Holds the $71,000 Line
While energy markets are in a frenzy, the Bitcoin price is showing remarkable resilience as a "digital gold" hedge. According to the latest 1-month chart, $BTC saw significant volatility throughout February, dipping as low as $63,000 on February 24th.
However, as the geopolitical tension escalated into March, Bitcoin staged a massive recovery. The chart shows a sharp vertical ascent starting on March 1st, breaking through the previous resistance at $68,000 and peaking near $73,000 on March 5th. As of today, March 6, 2026, BTC is consolidating around $71,044. The ability of $Bitcoin to maintain this psychological $70k level despite the global energy shock suggests that investors are increasingly viewing it as a safe-haven asset amidst fiat and commodity uncertainty.
Market Outlook and Connectivity
The current market structure is in deep backwardation, meaning spot prices are significantly higher than future delivery prices. This suggests that while the immediate "shock" is severe, the market is pricing in a hope for a diplomatic resolution by the summer of 2026.
However, for energy-heavy industries and consumers, the "Strait-jacket" effect on the Persian Gulf means higher inflationary pressures are inevitable. Investors looking for hedges have already begun rotating into safe-haven assets, with gold surpassing the $5,100 per ounce mark during this same period.
You May Also Like

Pi Network Surges 35.9% Weekly: On-Chain Data Reveals Unexpected Accumulation Pattern

IRS Sets Course for Digital-Only Tax Reporting for Cryptocurrency Users
