

Dogecoin Technical Setup Tightens After $0.0883 Hit-What’s Next?
Dogecoin hits $0.0883 target as DOGE tests lower channel support, with $0.1019, $0.1156 and $0.067 as key levels.
Dogecoin reached the $0.0883 target and moved into a key support zone. The DOGE price now trades near the lower channel boundary.
Traders are watching $0.1019, $0.1156, and $0.067 as the next major levels.
Dogecoin Tests Lower Channel Support
Dogecoin was trading near $0.0848 on the daily chart after falling below $0.10. The move kept the DOGE price under pressure and near multi-month lows.
Ali Charts said, “The lower boundary of the channel is now being tested.” The analyst added that recovery targets remain near $0.1019 and $0.1156 if support holds.
The $0.0883 target has now been met, so attention has shifted to the current support area. Buyers are watching the $0.084 to $0.080 range for a possible defense.
A hold above this range may allow DOGE to retest $0.1019. Stronger buying could then bring $0.1156 back into focus.
DOGE Price Faces Resistance Near $0.10
The $0.10 level remains the main resistance on the Dogecoin daily chart. A daily close above this level may reduce short-term selling pressure.
Dogecoin earlier climbed toward the $0.26 to $0.27 region, but that move failed. Since then, the chart has shown lower highs and lower lows.
The Fibonacci structure also shows weak price action after the latest decline. DOGE is trading below the lower range near $0.1002.
Further resistance levels sit near $0.137, $0.166, and $0.186. These areas may matter only after Dogecoin reclaims the $0.10 zone.
The current setup keeps sellers in control while price stays below that level. Buyers need a clean move above resistance to change the short-term structure.
As CoinMarketCap data shows, Dogecoin traded at $0.08474, down 4.57% in 24 hours. Its market cap stood at $14.42 billion, while 24-hour trading volume reached $1.41 billion, up 9.16%.
The data also showed a circulating supply of 170.24 billion DOGE and no maximum supply limit. The higher volume during the price drop suggests active selling pressure near the current support range.
Read Also:
RSI and MACD Keep Breakdown Risk in Focus
Momentum readings remain weak on the daily DOGE chart. The MACD line is below the signal line, and the histogram remains negative.
This setup shows that downside pressure has not fully eased. A recovery would need stronger demand and a clear move above nearby resistance.
The RSI is near 21.49, placing Dogecoin in oversold territory. Oversold readings can support a short bounce, but they do not confirm a reversal.
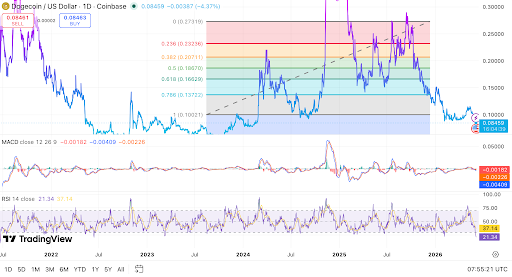 Dogecoin tests key support as bearish momentum persists. Source: TradingView
Traders may watch whether RSI moves back above 30. A move toward 50 would show a more balanced market setup.
If DOGE breaks below $0.080, lower support levels may come into view. The next downside areas include $0.075 and the major zone near $0.067.
The analyst said a breakdown “could expose the next major supply zone near $0.067.” That level remains important if channel support fails.
For now, Dogecoin technical analysis points to a tight setup. The next move depends on whether lower channel support holds during the current test.
The post Dogecoin Technical Setup Tightens After $0.0883 Hit-What’s Next? appeared first on Live Bitcoin News.


You May Also Like
MEXC Spot Market Adds Ondo Tokenized Plug Power, iShares MSCI South Korea and Japan ETFs

Bitcoin treasury sell-off accelerates as Riot, Bhutan, and public companies exit positions

AI predicts XRP price for April 30, 2026


