XRP is trading near $1.7 on the monthly timeframe, where price is interacting with a structurally important zone defined by long-term cycle behavior rather thanXRP is trading near $1.7 on the monthly timeframe, where price is interacting with a structurally important zone defined by long-term cycle behavior rather than

XRP Tests Structure, Not Collapse, as Fibonacci History Repeats

2026/01/31 22:46
3 min read
For feedback or concerns regarding this content, please contact us at crypto.news@mexc.com

XRP is trading near $1.7 on the monthly timeframe, where price is interacting with a structurally important zone defined by long-term cycle behavior rather than short-term volatility.

According to analysis shared by EGRAG CRYPTO, the current phase mirrors earlier market cycles, placing XRP at a decision point between continuation and structural failure.

The significance of this moment lies in cycle symmetry. Historically, XRP’s largest expansions have not occurred on the first impulse, but on the second surge, with Fibonacci extensions acting as probabilistic guides rather than guarantees.

Source: https://twitter.com/egragcrypto/status/2017526186671325463

Cycle Structure and Fibonacci Context

EGRAG’s analysis highlights a repeating pattern across prior cycles:

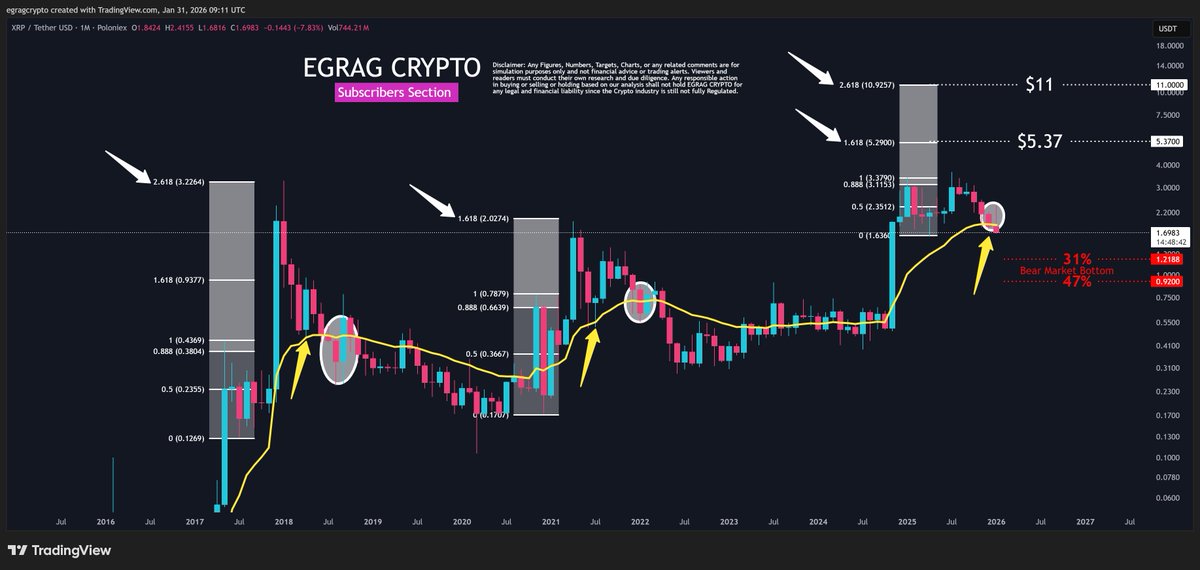
  • 2017 cycle: After the first surge, XRP’s second impulse topped near the Fib 2.618 extension.
  • 2021 cycle: The second surge was truncated at Fib 1.618, which the analyst attributes to external disruption rather than structural failure.

The key takeaway is that XRP has consistently respected Fibonacci extensions on the second impulse, not the first. At present, XRP remains in what EGRAG defines as a macro correction following the first surge, suggesting the second impulse has not yet activated.

The Role of the 21 EMA

A central technical reference in the analysis is the monthly 21 EMA, which XRP is currently testing. In both 2018 and 2021, the first touch of the 21 EMA after the initial surge produced a major relief bounce, followed later by a broader structure breakdown.

On the chart, this first-touch interaction is marked by white circles, showing near-identical positioning across cycles. The implication is not that a breakdown is imminent, but that this zone historically acts as a reaction point, where probability temporarily shifts in favor of a bounce before longer-term direction is resolved.

Bitcoin Tops Gold and Silver in $100,000 Investment Poll

Scenarios and Risk Balance

EGRAG outlines two structurally valid scenarios, with uneven probability weighting based on historical symmetry:

Primary continuation scenario (estimated 65–70%):

  • Monthly price holds near the 21 EMA
  • Market structure remains intact
  • A second impulse activates
  • Fibonacci-based upside reference levels:
    • Fib 1.618 near $5.37
    • Fib 2.618 near $11

Structural failure scenario (estimated 30–35%):

  • Monthly closes decisively below the 21 EMA
  • Acceptance develops below roughly $1.20–$1.30
  • Cycle symmetry breaks, invalidating the second-impulse framework

Importantly, the bearish scenario is framed as a structure break, not an open-ended collapse, with downside risk described as comparatively limited if symmetry fails.

Professional Takeaway

XRP is not currently signaling collapse, but testing structure at a level that has historically mattered across cycles. Fibonacci extensions provide probabilistic guidance, while the 21 EMA acts as the structural arbiter.

As long as price maintains acceptance above the $1.20–$1.30 zone, the long-term framework supporting a second impulse remains viable.

For now, outcome depends less on narrative and more on monthly confirmation. Fibonacci guides probability, but structure ultimately decides direction.

The post XRP Tests Structure, Not Collapse, as Fibonacci History Repeats appeared first on ETHNews.

Disclaimer: The articles reposted on this site are sourced from public platforms and are provided for informational purposes only. They do not necessarily reflect the views of MEXC. All rights remain with the original authors. If you believe any content infringes on third-party rights, please contact crypto.news@mexc.com for removal. MEXC makes no guarantees regarding the accuracy, completeness, or timeliness of the content and is not responsible for any actions taken based on the information provided. The content does not constitute financial, legal, or other professional advice, nor should it be considered a recommendation or endorsement by MEXC.

You May Also Like

Shibarium May No Longer Turbocharge Shiba Inu Price Rally, Here’s Reason

Shibarium May No Longer Turbocharge Shiba Inu Price Rally, Here’s Reason

The post Shibarium May No Longer Turbocharge Shiba Inu Price Rally, Here’s Reason appeared on BitcoinEthereumNews.com. Shibarium, the layer-2 blockchain of the Shiba Inu (SHIB) ecosystem, is battling to stay active. Shibarium has slipped from hitting transaction milestones to struggling to record any transactions on its platform, a development that could severely impact SHIB. Shibarium transactions crash from millions to near zero As per Shibariumscan data, the total daily transactions on Shibarium as of Sept. 16 stood at 11,600. This volume of transactions reflects how low the transaction count has dropped for the L2, whose daily average ranged between 3.5 million and 4 million last month. However, in the last week of August, daily transaction volume on Shibarium lost momentum, slipping from 1.3 million to 9,590 as of Aug. 28. This pattern has lingered for much of September, with the highest peak so far being on Sept. 5, when it posted 1.26 million transactions. The low user engagement has greatly affected the transaction count in recent days. In addition, the security breach over the weekend by malicious attackers on Shibarium has probably worsened issues. Although developer Kaal Dhairya reassured the community that the attack to steal millions of BONE tokens was successfully prevented, users’ confidence appears shaken. This has also impacted the price outlook for Shiba Inu, the ecosystem’s native token. Following reports of the malicious attack on Shibarium, SHIB dipped immediately into the red zone. Unlike on previous occasions where investors accumulated on the dip, market participants did not flock to Shiba Inu. Shiba Inu price struggles, can burn mechanism help? With the current near-zero crash in transaction volume for Shibarium, SHIB’s price cannot depend on it to support a rally. It might take a while to rebuild user confidence and for transactions to pick up again. In the meantime, Shiba Inu might have to rely on other means to boost prices from its low levels. This…
Share
BitcoinEthereumNews2025/09/18 07:57
Wormhole Unleashes W 2.0 Tokenomics for a Connected Blockchain Future

Wormhole Unleashes W 2.0 Tokenomics for a Connected Blockchain Future

TLDR Wormhole reinvents W Tokenomics with Reserve, yield, and unlock upgrades. W Tokenomics: 4% yield, bi-weekly unlocks, and a sustainable Reserve Wormhole shifts to long-term value with treasury, yield, and smoother unlocks. Stakers earn 4% base yield as Wormhole optimizes unlocks for stability. Wormhole’s new Tokenomics align growth, yield, and stability for W holders. Wormhole [...] The post Wormhole Unleashes W 2.0 Tokenomics for a Connected Blockchain Future appeared first on CoinCentral.
Share
Coincentral2025/09/18 02:07
Why Is Crypto Market Up Today? 5 Key Reasons Behind the Rally

Why Is Crypto Market Up Today? 5 Key Reasons Behind the Rally

The post Why Is Crypto Market Up Today? 5 Key Reasons Behind the Rally appeared on BitcoinEthereumNews.com. The crypto market is rallying today, with Bitcoin climbing
Share
BitcoinEthereumNews2026/03/11 04:47